Monday, December 14, 2009

Pseudonormalization of T waves, Coronary occlusion without 1 mm ST elevation

See 6 even better cases of T-wave pseudonormalization here.

Here is another case.  Do not miss this one:

A Middle-Age Male with Chest Pain that Recurs in the ED


This 64 year old woman presented intoxicated with nausea and vomiting and epigastric pain, with no chest pain. She has a history of a stent, but unknown in which artery. She stopped taking clopidogrel 2 weeks ago because she ran out. Here is the initial ECG; there was no previous ECG for comparison.


Notice there is deep symmetric T inversions in inferior leads, and a large upright T wave in aVL. There is also some T inversion laterally. This is all suggestive of inferior (and lateral?) Non-STEMI, due to reperfused RCA or circ. Inverted T waves are also known as "reperfusion" T-waves. If they are in the anterior leads, they are often referred to as "Wellens' T-waves."

A troponin returned elevated, and a repeat ECG was recorded:


Now the inferior T-waves have become mostly upright, in this case biphasic. There is some ST elevation, but it is not quite 1 mm in two consecutive leads. There is new ST elevation in lead V1, which in this context is diagnostic of right ventricular STEMI.

This phenomenon is called "pseudonormalization of T-waves" because normal T-waves are upright (same axis as QRS), but become inverted in non-STEMI that is reperfused. They become deceptively upright (not normal, but "pseudo" normal) when the artery re-occludes. Thus, where reperfusion of the infarct-related artery (IRA) leads to T-wave inversion, if inverted leads become suddenly upright, this is diagnostic of re-occlusion of the IRA.

There is nothing magical about 1 mm of ST elevation. ST elevation is used as a very imperfect surrogate for coronary occlusion. Coronary occlusion that does not spontaneously reperfuse or is not compensated for by collateral circulation will quickly lead to irreversible myocardial loss. Reperfusion therapy is indicated for occlusion, even when there is not 1 mm of STE in 2 consecutive leads. However, the specificity of the ECG for occlusion becomes less as the STE is less. So expertise in interpreting the ECG is particularly important for these cases.

In this case, it was clear that there was a very unstable thrombus in the RCA or circ, and that if it was not 100% occlusive, it was very nearly so.

The cath lab was activated, a 100% proximal RCA stent thrombosis was seen and the artery was opened.

This also illustrates how chest pain or even discomfort may be completely absent in STEMI. Below is the post-cath ECG, showing T-waves are now inverted again (indicating reperfusion).


Saturday, December 5, 2009

Posterior ST Elevation MI in the Setting of Right Bundle Branch Block, with Posterior Leads V7-V9

This is a 68 year old man who had a resuscitated cardiac arrest. His prehospital ECG looks identical to this one which was recorded upon arrival to the ED:
Add caption

There is sinus rhythm with a wide QRS, with rSR' in V1 and a wide S-wave in lateral leads, consistent with right bundle branch block (RBBB). ST elevation or depression in RBBB is not difficult to find if you identify the end of the QRS. In this case, the QRS duration is about 135 ms, and in V2 and V3 there are 2 small S-waves; only after these S-waves does the ST segment begin. There is also almost 4 mm of ST depression in right precordial lead V3. Some ST depression (up to 1 mm) in the opposite direction (discordant) to the positive QRS is normal in RBBB, as in V1 here. This much ST depression (V2 and V3) is always abnormal (ischemia).

Most posterior STEMI is in conjunction with either inferior STEMI, lateral STEMI, or both. Only 3-11% of all MI are isolated posterior. In this case, there is no ST elevation elsewhere on the ECG. Marked isolated ST depression in the right precordial leads in a clinical scenario consistent with STEMI is usually posterior STEMI. Such ST depression can also (much less likely) be due to subendocardial ischemia. Two modalities that can help are: 1) recording posterior leads V7-V9 and 2) echocardiography with a posterior wall motion abnormality. In this case, both were done. The posterior ECG is shown here and was done 31 minutes later. Leads labelled V4-V6 were actually recorded on the back as leads V7-V9 (V7 at posterior axillary line, even with tip of scapula; V9 paraspinal at same level; V8 between them).
There appears to be lead reversal of limb leads.  Notice opposite axis of I and aVL from first ECG.
The remainder is explained below.

There is only one lead with ST elevation, lead V9 (labelled V6). There is approx 0.75 mm of ST elevation. Up to 0.5 mm is within normal limits, but any amount in even one lead >/= 0.5 is abnormal and very sensitive and specific for posterior STEMI (Matetzky S. et al. JACC 1998;31:506-511. Matetzky S et al. JACC 1999;34:748-753. Taha B et al. J Electrocardiol 1998;31(Suppl):178-9. Wung SF et al. Am J Cardiol 2001;87:970-974;A4.) Moreover, the QRS amplitude in V9 is tiny, and the ST elevation is very high in proportion. Similarly, there is also now a small amount of ST Elevation (< 1 mm in context of very small QRS) in aVL, suggestive of lateral STEMI.

Emergency physician performed bedside echocardiogram showed evidence of posterior wall motion abnormality and no anterior WMA. Immediate angiography showed a thrombotic occlusion of the mid circumflex, as well as disease in the RCA and LAD. Formal Echo the next day confirmed posteriorlateral WMA. Max troponin I was 12 ng/ml.

Approximately 75% of posterior STEMI will manifest at least 1 mm of anterior ST depression. (Matetzky S et al. JACC 1999;34:748-753. Wung SF et al. Am J Cardiol 2001;87:970-974;A4.)

Sunday, November 29, 2009

STEMI best seen in PVC

See this post for a wide complex that hides ischemic findings.
See this post for a difficult diagnosis in the context of a wide complex.

Case
Here is a patient who had a cardiac arrest. Only approximately 25% of our atraumatic cardiopulmonary arrest patients have a STEMI (40% of v fib arrests) so the diagnosis of STEMI by the ECG is critical for the reperfusion decision. Here is the ECG:

The rhythm is atrial fibrillation. The QRS complex is wide, with a right bundle branch block but only subtle ST elevation in III and aVF, with very subtle reciprocal depression in lead aVL. The second complex in the ECG is a PVC, and is seen in leads I, II, and III. In leads II and III, in which the QRS of the PVC is predominantly negative (S-wave), there is marked discordant (opposite to QRS) ST elevation in leads II and III (inferior), far out of proportion to the preceding S-wave.  I believe (without proof) that appropriate discordance in a PVC should be similar to LBBB, in which the average ST/S ratio is 0.10, and excessive due to STEMI is greater than 0.20.   In lead I there is a positive QRS (R-wave) and reciprocal depression that is similarly discordant to the QRS and out of proportion.
These PVC findings confirm the diagnosis of inferior wall STEMI in this otherwise difficult ECG.

The patient had an RCA occlusion.

Saturday, November 21, 2009

Probable Left Main coronary artery occlusion/obstruction, with STE in aVR, alternating BBB, and arrest

This 59 yo male had sudden chest and abdominal pain and dyspnea. He called 911. Paramedics found him in profound distress, stating "I can't breathe". He had this prehospital ECG recorded at 0953:
There is sinus tach and a wide QRS, not quite 120 ms, with wide upright R-waves in lateral leads; this is consistent with incomplete Left Bundle Branch Block. There is concordant ST depression in V2-V4, excessively discordant ST depression in I, aVL, V4-V6, and extremely excessively discordant ST elevation in aVR.

ST elevation in aVR does not make for a STEMI by itself.  When there is ST elevation elsewhere (actual coronary occlusion of a major artery), usually anterior, then ST elevation in aVR correlates with worse disease and worse outcomes.  

When there is ST depression (NonSTEMI, with subendocardial ischemia), as in this case, ST elevation in lead aVR is reciprocal to the depression found in I, II, and V4-V6.  It is not independent of these findings but is a single finding that, when greater than or equal to 1 mm, correlates well with need for bypass surgery because the left main is involved (but not occluded) or there is 3-vessel disease.  It is a good reason not to give clopidogrel, because this can cause excessive bleeding in bypass surgery.

Thus, in NonSTEMI, ST elevation in aVR is one sign of high grade Left Main obstruction or 3-vessel disease.  In any case, there is widespread subendocardial ischemia. This is not a STEMI, but can be called a STEMI-equivalent.  Cath lab activation is prudent, as these patients have very high mortality.  Thrombolytics are NOT indicated.

This ECG confirms that acute coronary syndrome is the etiology of his illness and that cath lab activation is usually indicated, and always indicated if the symptoms and ECG findings cannot be controlled with medical therapy. The cath lab was activated.

He arrived in the Emergency department at 10:13 in severe distress. He was agitated, cool, and mottled with a weak pulse and O2 saturation of 44%. The following ECG was recorded at 10:15.
There is again sinus tach, but this time with Right Bundle Branch Block and a long PR interval. Alternating Right and Left BBB is a sign of impending complete heart block below the bundle of HIS, which would lead to asystole or ventricular escape (wide and slow complex). There is persistent ST elevation in aVR and ST depression in lateral leads.

Heart rate dropped to 36 with BP 53/30. Bedside ultrasound showed a normal right ventricle but very poor LV function. After stating "I can't breathe", the patient collapsed and could not be resuscitated. No autopsy was done, so left main obstruction cannot be proven, but this is the classic clinical and ECG presentation of such pathophysiology.

Though this is STEMI, it went entirely unrecognized by the computer algorithm. The medics and physicians knew what they were dealing with but the patient died too quickly for resuscitation.

Should this patient go to the cath lab while undergoing CPR? It is the only hope for survival, and there are case reports of survival in similar situations.

Friday, October 16, 2009

Severe Right Ventricular Hypertrophy

This 23 year old presented to the Emergency Department with pharyngitis, but also complained of dyspnea on exertion. This ECG was recorded:

The wide complex (QRS 155 ms) may distract your attention from the rhythm, which is simply sinus. There are massive S-waves in lateral leads, with an extreme right axis deviation (180 or -180, same thing). There are massive R' waves of RBBB in the right precordial leads. The combination of wide S-wave in V5 and V6, and large R' wave in lead V1 is diagnostic of RBBB. The precordial voltage is extreme, approximately 60 mm (6.0 mV) in V1.

So this is diagnostic of massive Right ventricular hypertrophy. One might be concerned for ischemia because of the large amount of ST depression and T wave inversion in V1-V3. Some discordant (in the opposite direction of a high voltage or bundle branch block QRS) ST depression and T inversion is usually found at baseline in RBBB, but this is more than usual. However, the voltage is also more than usual. The ratio of the ST depression to QRS voltage is about 4mm to 60 mm, or 0.067, which is normal. The troponin was mildly elevated due to demand ischemia of the RV.

Further history revealed congenital pulmonic stenosis which was dilated at age 7 days. The patient did not have further followup. Echocardiogram revealed an estimated peak systolic pulmonary pressure of 127 mmHg with RV enlargement and severe hypertrophy.

Monday, October 12, 2009

Comment on Posterior STEMI

I had a very good question regarding the post on posterior STEMI, and I wanted to be sure that the answer gets attention:

smallville said...

While your blog does an excellent job of highlighting posterior STEMIs that were mistaken, are there any solid criteria to help provide a DDx between anterior or subendocardial ischemia and posterior STEMI? Will posterior ST alteration always be limited to v2-v4?


This is a very good question, and not easily answered because there is very little solid research on this.

First, you should know that when there is precordial ST depression due to subendocardial ischemia, it is not necessarily due to anterior wall ischemia. Data from stress testing shows that subendocardial ischemia DOES NOT LOCALIZE on the ECG, and usually is in leads II, III, aVF and V4-V6. But, again, this does not tell you which artery is involved.

Second, ST depression in V1-V3, vs. V4-V6, is much more likely to be posterior than subendocardial ischemia.

Third, patients at higher risk of NSTEMI (older, more risk factors, h/o angiogram with multivessel disease) are much more likely to have subendocardial disease (vs., for instance, a younger smoker).

Fourth, patients with reasons to have demand ischemia (tachycardia, sepsis, GI Bleed, etc.) are much more likely to have subendocardial ischemia (like in a stress test); those with posterior MI are much more likely to present with onset of chest pain and with normal vital signs.

Fifth, look for tall R-waves in V1-V3 (the analog of Q-waves in other locations).

Sixth, an upright T-wave is much more likely to represent posterior MI, but probably signifies reperfusion of the artery rather than persistent occlusion. An inverted T-wave can be either subendocardial or posterior.

Seventh, placement of posterior leads is very helpful. Take leads V4-V6 and place them at the level of the tip of the scapula, with V4 placed at the posterior axillary line ("V7"), V6 at paraspinal area ("V9"), and V5 ("V8") between them. At lease 0.5 mm of ST elevation in 2 consecutive leads is very accurate for posterior MI.

References on posterior leads:

1) Matetzky S et al. Acute myocardial infarction with isolated ST-segment elevation in posterio chest leads V7-V9: "hidden" ST -segment elevation revealing acute posterior infarction. JACC 1999;34:748-53
2) Matetzky S et al. Significance of ST segment elevations in posterior chest leads (V7-V9) in patients with acute inferior myocardial infarction: application for thrombolytic therapy. JACC 1998;31 506-11.
3) Wung SF et al. New electrocardiographic criteria for posterior wall acute myocardial ischemia validated by a percutaneous transluminal coronary angioplasty model of acute myocardial infarction. Am J Cardiol 2001;87:970-4; A4.

Thursday, October 8, 2009

Altered Mental Status, Tachycardia, Hypotension, Hyperglycemia, Ill appearing

This diabetic patient with the ECG below was brought in by medics confused, tachycardic, and hyperglycemic, Kussmauling. The computerized ECG algorithm diagnosed Acute MI (I'm not sure why).

The ECG is diagnostic of hyperkalemia, with QRS of 180 ms. The QRS improved immediately after giving 2 doses of Calcium gluconate. K returned at 7.3, with a pH of 6.91, HCO3 of less than 3. After a total of 5 doses of Ca gluconate, 6 doses of bicarb, 4 liters of fluid, and insulin, this patient with extremely severe diabetic ketoacidosis stabilized. He had some demand ischemia, with maximum troponin of 1.5, but there was no acute coronary syndrome.

His ECG from the next AM is shown below; the QRS is now less than 120 ms.

Left Ventricular Hypertrophy May Result in Profound ST Elevation

This 75 year old man presented with weakness. His blood pressure was 220/80. He was found to have renal failure. He ruled out for MI.

There are 4 mm of ST elevation in leads V2 and V3, but it not out of proportion to the very large (greater than 50 mm) preceding S-wave. This is typical of severe LVH with repolarization abnormalities.

It would be an unusual EKG for anterior STEMI.

In fact, it is very difficult to find a case of anterior MI with extreme voltage like this; this is probably because profound ischemia of LAD occlusion (STEMI) alters the QRS voltage and attenuates the severity of the electrocardiographic LVH voltage.

If anyone out there has such a case (proven LAD occlusion with very large voltage suggestive of LVH), please send it to me!

Wednesday, August 26, 2009

Inferior Hyperacute T-waves

This is a 58 year old male with 40 minutes of chest pain of acute onset. He called 911 and paramedics recorded a prehospital 12 lead ECG which showed a clear inferior STEMI (not shown, tracing could not be found). He was given aspirin and sublingual nitroglycerine, which improved his pain. The cath lab was activated by the paramedics. On arrival, the following ECG was recorded.

There is 0.5 mm of ST elevation in inferior leads II, III, and aVF. In addition, the T-waves in II, III, and aVF are very large, significantly larger than normal in both height and width. To diagnose inferior MI, there must always be reciprocal ST depression or T-wave inversion or both in lead aVL (see abstract of our research below). This is present here.

Hyperacute T-waves can be present early, before the ST segment elevates, but they can also be present as ST elevation is resolving from spontaneous reperfusion.

In this case the diagnosis was clear due to the prehospital ECG. But suppose there had been no prehospital ECG? Or if the first ECG had looked like this? Suppose the ST segments were on the way up rather than on the way down. Would you have diagnosed this? This identical ECG could be all the evidence you might have.

If you find yourself in this diagnostic dilemma and you are uncertain of the diagnosis, remember that you can use serial ECGs, old ECGs, and immediate echocardiography to help in the diagnosis.

Also, remember the value of lead aVL: see this post.   And this one

Click here for a great case of developing inferior MI with hyperacute T-waves.


Research presented at 2011 SAEM in Boston.
Published in Academic Emergency Medicine, vol. 18 (5 Suppl 1):Abstract 425, p. S164-S165.


In acute inferior STEMI, Reciprocal ST depression in aVL and T-wave inversion in aVL are both more sensitive than ST elevation criteria and appear earlier in the course of STEMI
Christine Worrall
Emily Vogel
Stephen W. Smith

Background:  A previous study found that reciprocal ST depression (rSTD) is present in only 82% of inferior ST elevation (STE) acute myocardial infarction (MI).  However, we believe that changes in lead aVL are far more sensitive.  Objectives: To find the incidence of any rSTD or T-wave inversion (TWI) in angiographically proven inferior STEMI.  Methods: We searched the catheterization laboratory database for all cases coded as acute Inferior STEMI from January 2002 through March 2008.  All cases were reviewed and the presenting ECG, as well as the first ECG that was used for diagnosis of acute STEMI, were analyzed.  “True STEMI” was defined as 100% occlusion or as a culprit lesion with maximum troponin I (trop) > 10 ng/ml.  STE was measured in leads II, III, aVF; aVL was scrutinized for any rSTD or TWI.  TWI was defined as a T-wave mostly down, or a biphasic T-wave that is first down, then up (not up then down, which is associated with lateral AMI).  Reperfusion criteria were defined as STE of at least 1 mm in 2 of 3 of inferior leads II, III, aVF.   Results: There were 160 unique cases.  107 had 100% occlusion, and 35 had < 100% occlusion, but had a maximum trop > 10 ng/ml, for 142 true STEMI; 18 (11%) had < 100% occlusion and a max trop < 10 ng/ml.  85% of the diagnostic ECGs of true STEMI, and 84% of all cases, met STE criteria.  No true STEMI had absence of reciprocal depression in lead aVL. Of the 107 with 100% occlusion, 100 (93%) had at least 0.5 mm of rSTD; the remainder had rSTD of < 0.5 mm.  Even among those without true STEMI, 94% had some rSTD in aVL.  Additionally, in 44 cases (28%), there was no STE whatsoever on the presenting (first) ECG; all of them had either rSTD or TWI.  See Table.  Conclusion: STE criteria for inferior STEMI are insensitive, especially on the presenting ECG.  Changes in aVL, both some amount of rSTD and also TWI, are more sensitive than STE criteria in the diagnosis of inferior STEMI and are nearly universally present in inferior STEMI.  These changes also appear earlier than STE.

Persistent ST elevation after previous MI, otherwise known as "LV aneurysm" morphology

Case 1. Classic anterior LV aneurysm morphology (Persistent ST elevation after previous MI).

This 46 yo male presented with chest pain. There is 1 mm of ST elevation in V1-V3, but there are large QS-waves preceding the STE. Such QS waves are highly suggestive of old transmural MI, with subsequent akinesis or dyskinesis of the anterior wall. Acute MI, if early in its course (first 6 hours, at least), always has tall T-waves in addition to ST elevation.

There is one retrospective study (Smith SW. American Journal of Emergency Medicine 23(3):279-287, May 2005) showing that the T/QRS ratio is significantly greater in acute anterior STEMI than in old anterior MI with persistent ST Elevation.  We have since validated this and are writing the manuscript as of November 2014.

The best criterion for differentiating was the sum of STE in V1-V4 divided by the sum of the QRS's in V1-V4 (TV1+TV2+TV3+TV4 divided by QRSV1+QRSV2+QRSV3+QRSV4). If this value was greater than 0.22 vs. less than 0.22, then it is likely to be acute STEMI. 

Another rule that was almost as good: if any one of the leads had a ratio of T to QRS greater than, vs. less than, 0.36, it was very likely to be STEMI.

T-waves in aneurysm may be upright or inverted, but in neither case should they have high voltage. [Deep inversions suggest very recent NSTEMI (e.g., Wellens'). Tall T-waves suggest acute STEMI.]

The above ECG has a summed ratio of 0.05 and is clearly NOT an acute STEMI. It is important to know that only about 70%-80% of patients with the ECG morphology of "LV aneurysm" actually have an LV aneurysm, as defined by echocardiographic dyskinesis. "LV aneurysm" is far less common in this era of reperfusion, in which STEMI is not allowed to progress to full infarction (also known as "transmural" infarction, an old but useful term). The patient above had akinesis and had formerly had a mural thrombus, which is a common complication of an immobile wall which also may have post-infarction inflammation.

This patient ruled out for MI with negative troponins.

Case 2. Exaggeration of persistent STE after old MI by tachycardia

This 65 yo male presented with dyspnea but no CP. The lungs sound wet. The ECG is shown.
There is quite a bit of ST elevation in the anterior leads, but it is preceded by very deep QS waves suggestive of old MI. Previous MI can have persistent ST elevation, and just like in Left Bundle Branch block and other entities, ST elevation may be exaggerated in states of tachycardia. Therefore, the T-wave to QRS ratio may also be exaggerated. Here the formula TV1+TV2+TV3+TV4 divided by QRSV1+QRSV2+QRSV3+QRSV4 = 0.27, substantially greater than 0.22, and would indicate acute STEMI. But one must be suspicous of a false positive in the presence of extreme tachycardia such as this. Also arguing against STEMI is the fact that there is no single T/QRS ratio (V1-V4) greater than 0.36.

The difficult decision is this: is this an old MI with exaggerated persistent STE due to tachycardia, or is it an old MI with a new STEMI superimposed? Given that the BNP was greater than 5000 and the patient had no chest pain, and the high likelihood that such a morphology represented the former (not the latter) diagnosis, the patient was not set up for angiogram and reperfusion.

A previous ECG was found and is shown:

It is evident that there previously was classic LV aneurysm morphology, but with much less ST elevation and shorter T-waves. The ratio here is low.
For rule 1: (4.5 + 7.5 + 4 + 0) divided by (14.5 + 31 + 20 + 19) = 0.19 (less than 0.22)
For rule 2: the lead with the highest ratio is V1: 4.5 divided by 14.5 = 0.31 (less than 0.36)

A previous echo had shown severe decreased LVF with an akinetic anterior wall.

Clinicians correctly interpreted the first ECG as exaggeration of ST elevation of old MI due to tachycardia, stress, and exacerbation of CHF. Treatment of CHF resulted in a slowing heart rate. Follow up confirmed all troponins negative and resolution of ST elevation when the heart rate came down.

The computer is often wrong

For more on computer misses, click here:

This is the prehospital ECG of a 37 year old male with chest pain. It is obviously an acute STEMI, and in this case involved a proximal wraparound LAD supplying the anterior, lateral, and inferior walls. Hence the widespread ST elevation which the computer algorithm interprets as pericarditis. If the computer can make this mistake, you know it can make much less egregious mistakes (and I'll assure you that it does).

Therefore, you must learn to read the ECG yourself.


Comments indicate that I need to explain this better: The ECG represents anterior STEMI, and not pericarditis, because 1) the ST elevation is in right precordial leads (V1-V3) as well as left (V4-V6) [pericarditis has more in the inferior and lateral leads and often looks like an inferolateral STEMI] 2) unlike pericarditis, the T waves are "hyperacute", with straight ST segments; they look wide and bulky 3) there is very poor R wave progression, 4) there is "terminal QRS distortion", meaning the S-wave is obliterated in many leads, particulary V4-V6, and 5) the QT is long. All of these favor acute STEMI over pericarditis.

Wednesday, June 10, 2009

Acute anterior STEMI from LAD occlusion, or Benign Early Repolarization (BER)???

For another fascinating related ECG, click here
Acute MI from LAD occlusion, or early repolarization? 

Case:

This is a 46 yo male with acute onset of chest pain, in distress, who called the ambulance. He arrived and had this ECG recorded at 0118 AM. 


A followup ECG and the answer is below.

There is 1 mm of ST elevation in V2 and V3, so this meets the criteria for reperfusion by the ACC/AHA guidelines. Unfortunately, the majority of patients who meet such "criteria" do not have MI. The most common reason for ST elevation is early repolarization.

(In this case, the limb leads are suggestive of ischemia as well, with some subtle ST depression inferiorly, suggesting pending ST elevation in aVL due to lateral MI from proximal LAD occlusion.)

I have developed a decision rule to differentiate Anterior STEMI from BER in patients who present to the ED with chest pain. These rules only apply when the DDx is Anterior MI vs. BER. A simple rule is the R-wave rule, which depends on the fact that, in BER, the R-wave is always well developed:

If the mean R-wave amplitude from V2-V4 is less than 5 mm, then it is almost certainly MI. If greater than 5 mm, it is probably BER. A cutoff of 5 mm gives a sensitivity for MI of about 70%, but a specificity of greater than 95%.

There are a couple other more complex rules, one of which uses QTc-B, R-wave amplitude in lead V4, and ST elevation at 60 ms after the J-point in lead V3.

Another equally accurate one, also derived using logistic regression, uses QTc and 2 averages: mean ST elevation at the J point (STEJ) from V2-V4 and mean R-wave amplitude from V2-V4.

Both rely on the findings that the mean ST elevation was higher in the MI group, and the mean QTc in BER is shorter (mean = 390 ms), and mean R-wave amplitude is lower.

If the formula: (1.553 x mean STEJ in mm) + (.0546 x QTc in ms) - (0.3813 x mean RA in mm, not mV) is > 21, vs. less than or equal to 21, then it represents MI with high sensitivity and specificity.

In this case, the values are (1.553 x 1.0) + (.0546 x 420) - (.3813 x 1.17) = 1.553 + 22.93 - 0.3813 = 24.1

Thus, the rule predicts that this is anterior MI.

The clinicians were suspicious of MI, so they were smart to obtain serial ECGs. They obtained the second ECG at 0143:
This shows unequivocal straightening of the ST segments, compared to the first ECG. This ST straightening results in T waves which are fattened and "hyperacute". This is diagnostic of anterior STEMI.

In case you can't see this difference in the straightening of the ST segment, here they are side-by-side:

He had a 100% proximal thrombotic LAD occlusion with TIMI-0 flow. It was opened and stented.

The followup ECG might give an idea of what this patient's T-waves looked like before his occlusion:


Friday, June 5, 2009

ST elevation on prehospital ECG is gone upon arrival to the ED

This is a 55 yo male with chest pain. The medics recorded the first ECG, which shows unequivocal ST elevation in leads V4-V6.


Our medics have the authority to activate the cath lab from the field, and they did so. After arrival in the ED, the second ECG was recorded.

There is no significant ST elevation here. It has resolved spontaneously. There is ST depression with hyperacute T waves, best seen in lead V3. This has been associated with 3% of LAD occlusion (http://content.nejm.org/cgi/content/extract/359/19/2071).

The patient had LAD occlusion; because of the prehospital ECG, and the authority to activate the cath lab, his door to balloon time was 36 minutes. Had there been no prehospital ECG, there may have been no coronary intervention at all because of the absence of ST elevation in the ED.

Atrial fibrillation with rapid ventricular response with ECG injury pattern

This elderly woman presented hypotensive, pale, and tachycardic.  Here is the initial ECG. 

There is an irregularly irregular rhythm (atrial fibrillation) with a very fast ventricular response.  There is an injury pattern, with ST elevation in II, III, aVF, reciprocal ST depression in I and aVL, and ST depression of posterior injury in precordial leads.

Did we activate the cath lab?  No. We looked at the whole patient, not just the ECG.  We suspected GI bleed and this was confirmed with blood on rectal exam.  An ultrasound of the inferior vena cava confirmed that it was flat (low central venous pressure).  Had this been a primary cardiac event, the CVP would be high and the IVC distended, and the patient might have also been in pulmonary edema.

She was given blood and fluids until the bedside ultrasound showed good central venous pressure (distended inferior vena cava), but she remained hypotensive, tachycardic, and the ST elevation did not resolve. Thus, we electrically cardioverted her at 200J biphasic, but this was unsuccessful x 3. We infused amiodarone 300 mg IV, but with no improvement, and a subsequent cardioversion was again unsuccessful.  We then loaded her with 500 mcg/kg of esmolol and started her on a 50 mcg/kg/min drip, after which a fifth cardioversion was successful, and resulted in the second ECG shown here:

The rhythm is sinus, rate normal, and all ST elevation and depression is now resolved.

Troponin peaked at 19, and there was a subsequent inferior wall motion abnormality. A stress sestamibi showed no inducible ischemia, so no cath was done. Whether there was thrombus in the infarct-related artery, or whether this was only demand ischemia (Type II MI) is uncertain. Nevertheless, it is wise to convert atrial fibrillation with a rapid response when the patient is unstable; any injury pattern on the ECG constitutes instability.

Though demand ischemia usually shows as ST depression (or nonspecific findings) on the ECG, it may occasionally present with injury (ST elevation).

Monday, April 6, 2009

Right BBB and Bigeminy, with Anterior STEMI

This is from a 53 year old male smoker with chest pain.
Here is the initial EKG:
There is grouped beating, in couplets. Both complexes in each couplet are wide. the first complex in each couplet is preceded by a p-wave. If you look at the first of each couplet in V1 and V6, they have RBBB morphology. So this is bigeminy with RBBB. Obviously, the ST and T wave are very abnormal, with huge ST elevation due to LAD occlusion.

In the inferior leads, there appears to be ST elevation in both complexes, but this is not so: what appears to be STE is really just a prolonged QRS.

Thanks to Dave for this case: http://tassieparamedic.blogspot.com/

Wednesday, April 1, 2009

Pure (Isolated) Posterior STEMI -- not so rare, but often ignored!

Click here for more cases of posterior MI, and more explanation


Case 1.
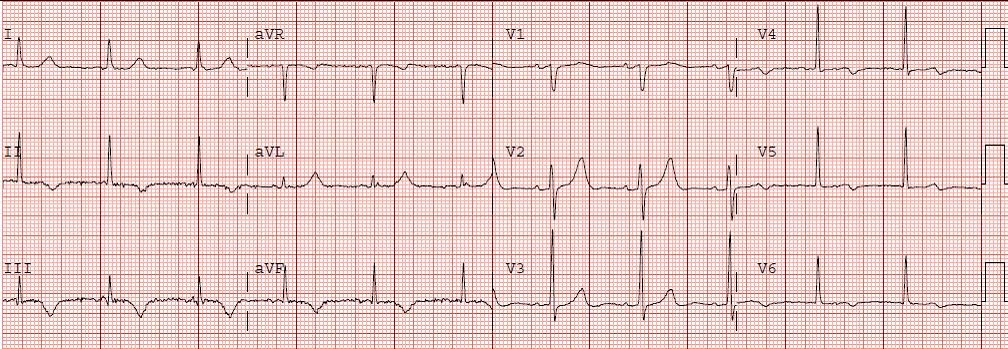
This is a 44 yo male with h/o HTN, CABG at age 34, and 2 drug eluting stents to the first diagonal graft 3 months prior. He presented at 1810 with chest pain 5 days after stopping clopidogrel (on the instructions of another physician). The following ECG (#1) was recorded, with ECG #2 as his baseline.

#1, presenting ECG


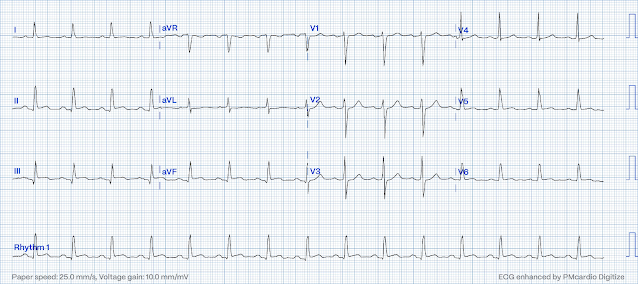
 #2, baseline from 3 months prior


 #1 shows new marked ST depression in V2 and V3.

The differential diagnosis is subendocardial ischemia with probably NSTEMI vs. posterior STEMI. By ECG alone, posterior MI is more likely because of maximal ST depression in right, as opposed to left, precordial leads. However, given the history of severe 3 vessel coronary disease it is prudent to start with medical management, then observe for resolution of pain, but to also obtain an immediate echocardiogram to ascertain which wall is involved. If pain or ECG findings do not resolve, or if there is posterior wall motion abnormality, then immediate angiography with PCI is indicated.

In this case, maximal medical therapy was undertaken with Aspirin, clopidogrel, heparin, eptifibatide, metoprolol, and IV nitroglycerin and the patient was admitted to the CCU with cardiology consulted immediately. Chest pain resolved and angiogram was not done until the next day. It showed a 100% re-occluded SVG stent to D1; thrombus was suctioned out. Echo confirmed posterior wall motion abnormality. Max troponin was 47.

Case 2.

54 yo female with h/o smoking, DM, HTN, c/o chest pain for 3 hours, substernal radiating to both shoulders. She has an initial ECG which shows diffuse ST depression and she was treated for NSTEMI. She developed some pulmonary edema after metoprolol. ECG #2 was recorded:


ST depression is maximal from V2 to V4. This is due to posterior STEMI until proven otherwise. Unfortunately, it was treated as an NSTEMI for 2.5 hours until an echocardiogram showed a posterior wall motion abnormality. Cath revealed a 100% occluded circumflex. This was opened and stented, with the convalescent ECG below, which shows large upright posterior reperfusion T waves with a long QT.


How can such delay be avoided? By recording posterior leads V7-V9, at the level of the tip of the scapula and at the posterior axillary line (V7), a position midway between this and the spine (V8), and a paraspinal lead (V9). Also, obtaining a stat echo. Most of all, recognize this ECG pattern as being by far more likely to be posterior STEMI than due to subendocardial ischemia, which has maximum ST depression in leads V4-V6.

Case 3.

Here is a case of a 66 yo male with a history of CAD who presents with 1.5 hours of chest pain and is stable.


There is ST depression maximal in, again, V2-V4. The vast majority of posterior STEMI is not isolated, but rather concurrent with inferior and/or lateral involvement. In this case there is subtle ST elevtion in the inferior leads, not noticed by the treating physicians. Compare these ST segments with those of the post reperfusion ECG below:


The patient had rapid PCI of a 100% acutely thrombotically occluded mid circumflex which was opened and stented. There was 3 vessel disease.

How common is posterior STEMI and what is the significance of precordial ST depression in ACS?

There are many studies that indirectly reveal that the percent of STEMIs that are isolated posterior is between 3 and 11% (about 8%). More recently, a substudy of the recent TRITON-TIMI 38 trial comparing Prasugrel to Clopidogrel for ACS enrolled 13,608 patients; 1198 had isolated ST depression in V1-V6. Of these, 314 (26%) had occlusion (TIMI 0 or 1 flow) of the infarct-related artery (i.e., STEMI).  Reference and link to full text below.

There were 3534 other STEMIs in this study, not including the 314 with ST depression only (most probably posterior STEMI, but this is not specified). Add these 314 to the 3534 and you have 314/3848 (8.1%) of STEMI, many of which have pure isolated posterior STEMI. This conforms with the previous smaller studies. Moreover, the cath was done a median of 29.4 hours after presentation, so this does not account for those arteries that spontaneously reperfused (about 25% of STEMI will reperfuse with antiplatelet and antithrombotic therapy alone within one day -- old data). Thus, there were probably even more occluded arteries.

Only 14/314 (4.5%) were interpreted by the investigator as STEMI. None of the patients with an occluded artery had an ECG to PCI time less than 6 hours.

This is not a "rare" event, as I have heard cardiologists claim.

However, note that 3/4 of patients with precordial ST depression did NOT have an occluded artery.  Thu, it is very important that you critically evaluate precordial ST depression and do not assume it is posterior STEMI.  You will be wrong often, and I have seen many false positive cath lab activations based on a too simplistic approach.


Are there any solid criteria to help provide a DDx between anterior or subendocardial ischemia and posterior STEMI?

This is a very good question, and not easily answered.

First, you should know that when there is precordial ST depression due to subendocardial ischemia, it is not necessarily due to anterior wall ischemia. Data from stress testing shows that subendocardial ischemia DOES NOT LOCALIZE on the ECG, and usually is in leads II, III, aVF and V4-V6. But, again, this does not tell you which artery is involved.
Second, ST depression in V1-V3, vs. V4-V6, is much more likely to be posterior than subendocardial ischemia.
Third, patients at higher risk of NSTEMI (older, more risk factors, h/o angiogram with multivessel disease) are much more likely to have subendocardial disease (vs. younger smoker).
Fourth, patients with reasons to have demand ischemia (tachycardia, sepsis, GI Bleed, etc.) are much more likely to have subendocardial ischemia (like in a stress test); those with posterior MI are much more likely to present with onset of chest pain and with normal vital signs.
Fifth, look for tall R-waves in V1-V3 (the analog of Q-waves in other locations).
Sixth, placement of posterior leads (take leads V4-V6 and place them at the level of the tip of the scapula, with V4 placed at the posterior axillary line ("V7"), V6 at paraspinal area ("V9"), and V5 ("V8") between them. At least 0.5 mm of ST elevation in just one lead appears to be the most sensitive and specific single "criteria" for posterior MI.  

Posterior leads may be falsely negative. 

See these cases: 

http://hqmeded-ecg.blogspot.com/2013/01/precordial-st-depression-what-is.html
http://hqmeded-ecg.blogspot.com/2011/05/posterior-leads-fail-to-diagnose.html
http://hqmeded-ecg.blogspot.com/2014/12/do-not-confuse-diagnosis-of-posterior.html

Seventh, an immediate echocardiogram can make the distinction
Eighth.  Whether or not it is STEMI, the cath lab should be activated if the ischemia cannot be controlled medically: aspirin, nitro, beta blockers, clopidogrel, heparin/enoxaparin, GP IIb/IIIa inhibitor. 


The T-wave in posterior STEMI

Notice also that in the first (pre-reperfusion) ECG of case 3, the T wave is not upright as in previous cases. Some authors claim that the T wave must be upright for posterior STEMI. Evidence for this is lacking. In fact, an upright T wave probably indicates reperfusion of the posterior STEMI, whereas an inverted T wave is the analog of a hyperacute T wave (still occluded) but recorded from the opposite side. Either can be present in posterior STEMI, depending on the state of microvascular perfusion due to recanalization or to collateral circulation.


Here is a short summary of data on posterior leads, from: 


Critical Decisions in Emergency and Acute Care Electrocardiography.  William Brady and JD Truwit, editors.  Blackwell Publishing 2009. (Smith SW as editor of section on Acute Coronary Syndromes).  This is a quoted excerpt from a chapter that was written by Daniel T. O’laughlin, MD, and edited by me.

Posterior Lead Orientation and Diagnostic Criterion
The posterior precordial leads are positioned in the 5th intercostal space at the same horizontal line as V6.  Lead V7 is placed at the posterior axillary line, V8 just below the tip of the scapula and V9 at the paravertebral border.1  STE up to 0.5mm measured at the J point relative to the PR segment in all three leads can be normal.2  Wung and Drew evaluated the posterior ST segment changes during PTCA of the LCX and determined that utilizing a criterion of STE of greater than or equal to 0.5mm, rather than greater than or equal to 1mm, demonstrated a sensitivity of 94% for detecting LCX occlusion related STE.3  This is compared to a sensitivity of 49% when the criterion was greater than or equal to 1mm STE.  Conversely, Matetzky et al. showed 100% specificity for posterior MI of STE greater than or equal to 0.5mm in at least one posterior lead.  In Wung’s study, 81% of patients with greater than or equal to 1mm STE in posterior leads also had other significant STE on the 12-lead ECG, and 96% had some ST deviation.3 However, 22-39% of patients experiencing posterior MI who have greater than or equal to 0.5mm STE in the posterior leads do not demonstrate STD in V1-V3.3-5


1.         Kligfield P, Gettes LS, Bailey JJ, et al. Recommendations for the Standardization and Interpretation of the Electrocardiogram: Part I: The Electrocardiogram and Its Technology: A Scientific Statement From the American Heart Association Electrocardiography and Arrhythmias Committee, Council on Clinical Cardiology; the American College of Cardiology Foundation; and the Heart Rhythm Society Endorsed by the International Society for Computerized Electrocardiology. Circulation 2007;115(10):1306-24.
2.         Taha B, Reddy S, Agarwal J, Khaw K. Normal limits of ST segment measurements in posterior ECG leads. J Electrocardiol 1998;31 Suppl:178-9.
3.         Wung SF, Drew BJ. New electrocardiographic criteria for posterior wall acute myocardial ischemia validated by a percutaneous transluminal coronary angioplasty model of acute myocardial infarction. Am J Cardiol 2001;87(8):970-4.
4.         Matetzky S, Friemark D, Feinberg MS, et al. Acute myocardial infarction with isolated ST-segment elevation in posterior chest leads V7-V9: "hidden" ST-segment elevations revealing acute posterior infarction. J Am Coll Card 1999;34(3):748-53.
5.         Matetzky S, Freimark D, Chouraqui P, et al. Significance of ST segment elevations in posterior chest leads (V7-V9) in patients with acute inferior myocardial infarction: application for thrombolytic therapy. J Am Coll Card 1998;31(3):506-11.
6. Pride YB, Tung P, Mohanavelu S, et al. Angiographic and ClinicalOutcomes Among Patients With Acute Coronary Syndromes Presenting With IsolatedAnterior ST-Segment Depression: A TRITON–TIMI 38 (Trial to Assess Improvement in Therapeutic Outcomes by Optimizing Platelet Inhibition With Prasugrel–Thrombolysis In Myocardial Infarction 38) Substudy Journal of the American College of Cardiology: Cardiovascular Interventions 2010;3(8):806-11.

Monday, March 2, 2009

Circumflex Occlusion May be Subtle or Invisible on the ECG

Case 1

Below are 2 cases of circumflex or obtuse marginal (branch of circumflex) occlusions showing how subtle they may be:

A 52 y.o. male presents because he "thought he might be having a heart attack." He reports intermittent CP and SOB for 2-3 days. Pain worsened and became sharper after lifting a bookcase up the stairs. He continued to have worsening pain and diaphoresis, and associated left arm pain down to the fingers. Pt. reports MI in 2001 with a stent placed in the "marginal" artery. Pain is similar, but associated with less SOB. Exam is unremarkable. Here is the EKG at 1810:


A repeat ECG 1 hour later is subtly changed, with some evolving T-wave inversion best seen in V5 and V6.
This is diagnostic of inferior and lateral OMI, possibly with reperfusion since the T-waves are inverted.

Here is the PM Cardio Digitization:

I sent this ECG to the Queen of Hearts (PMcardio OMI), and here is the verdict:
OMI with High Confidence


A stat echocardiogram would have helped to make this diagnosis and facilitate timely reperfusion. Angiography and PCI were undertake 8 hours after the initial ECG and showed a completely occluded OM-1. Echo revealed inferior-posterior wall motion abnormality and 4th generation troponin I peaked at over 100 ng/mL (A huge OMI)!

It is not unusual for occlusions of the circumflex or its branches to show little on the ECG even though they represent a large amount of ischemic myocardium at risk for complete infarction. The circumflex territory is known as being "electrocardiographically silent".

How can you make the diagnosis? First, this patient had a known stent in the "marginal" artery and thought he was having a heart attack. In such a situation, when you know that the circumflex is the likely culprit artery, you may suspect that an MI will not be obvious on the ECG. In this case the ECG was diagnostic of OMI.  
But if you don't see it and don't have the Queen of Hearts, additional diagnostic testing is warranted. Possibilities include: serial ECGs (which were done but still nondiagnostic), stat echocardiogram, or posterior ECG. Use of the PRIME ECG 80 lead body surface mapping shows great potential for improving diagnosis in such cases.

By definition, this is a non-STEMI because there is not 1 mm of ST elevation in 2 consecutive leads. However, ST elevation is only an imperfect surrogate for complete acute persistent occlusion of an epicardial coronary artery without collateral circulation. It is neither fully sensitive nor specific. Even though the patient's ECG did not meet criteria for STEMI, this OMI had all the pathology of a STEMI.

Case 2

A 38 year old male with h/o smoking only c/o a few hours of severe substernal chest pain; he thinks he is having a heart attack. The pain is very nitroglycerine responsive. The first ECG with pain (unavailable) showed T wave flattening in V2 and V3. After resolution of pain with sublingual nitroglycerine, the second ECG was changed to near normal:

I sent this ECG to the Queen of Hearts (PMcardio OMI), and here is the verdict:

Not OMI with High Confidence


73 minutes later, the patient developed pain again:
This again is highly suggestive of inferior OMI.

I sent this ECG to the Queen of Hearts (PMcardio OMI), and here is the verdict:
 
Not OMI with Low Confidence


Nitroglycerine again eventually resolved the pain, and the following ECG was recorded at 2234:
There is reperfusion in inferior leads and a large T-wave in V2 (posterior reperfusion)

This change makes it clear that the findings on the 2nd ECG were indeed due to OMI!!


These T-waves represent reperfusion of the posterior wall, what I call "posterior reperfusion T-waves."   Click here for more such cases. 

The troponin I returned at 0.81 ng/ml, so the patient was started on heparin and eptifibatide, in addition to IV nitroglycerine and Metoprolol (and, of course, aspirin).

His angiogram the next day revealed a 100% mid dominant circumflex occlusion that supplied the inferior and posterior walls. There was a large LAD that collaterally supplied some of the inferior wall. Echo showed an inferior-posterior wall motion abnormality. The troponin peaked at only 13 ng/mL, probably because of the collateral circulation from the LAD.

How could we have gotten him to angiography and PCI faster? Patients with objective evidence of acute coronary syndrome (positive troponin or ECG) AND uncontrollable pain should get emergent PCI even if they do not have ST elevation. This patient did become pain free on maximal medical therapy, so PCI was not indicated.

Fortunately, his MI was not huge by biomarkers, but it was large (most OMI are higher than 10 ng/mL of Troponin I). Although he had a wall motion abnormality, this may go away over time.

Wednesday, February 25, 2009

Right Bundle Branch Block with Acute ST Elevation Seen Best on Prehospital ECG

This patient is 38 years old with hyperlipidemia. He was at the gym when he had the onset of chest pain. EMS was activated and recorded the following ECG (scanned from a prehospital ECG, so the quality is not perfect):

Notice the small Q wave in V1 followed by a very large R-wave, with a prolonged QRS. There is a wide S-wave in V6. Thus, there is right bundle branch block, which should never (unlike Left BBB) have any ST elevation. But here there is a large degree of ST elevation in V2-V6, I, and aVL. RBBB in acute STEMI has a very high mortality.

The paramedics activated the cath lab from the field.

The patient had 2 ventricular fibrillation arrests during transport, but was immediately defibrillated both times, and was awake in the ED, when the following ECG was recorded:


The ST elevation has mostly resolved on this ECG, and were it not for the arrest and the prehospital ECG, this would not be a slam dunk diagnosis. There is still ST elevation in I and aVL, but it is subtle. There are abnormal T waves in V2-V4, with straightening of the ST segment which is typical of hyperacute T waves.

Angiography revealed a very tight LAD stenosis with some flow (confirming the reperfusion that we see on the ECG). A stent was placed, and the patient had an excellent outcome with no wall motion abnormality.

Learning point: the prehospital ECG is critical, as was early prehospital cath lab activation. Were it not for this prehospital ECG and the cardiac arrest, the diagnosis may have been significantly delayed. Had this happened, the artery may have re-occluded prior to angiography, with resultant recurrent cardiac arrest and/or shock and death.

Friday, February 20, 2009

Elderly With No Symptoms, Wellens's Thus Overlooked, Then ST Elevation Doubted

Here is a case of an 89 year old woman who had syncope but no chest pain or shortness of breath. Her initial EKG (#1) shows some ST depression in V4-V6, possibly ischemic or possibly due to LVH. She has a troponin of 0.13 ng/ml (ref range up to 0.09).

(#1)


She is admitted, her trop peaks at 0.23, her next day EKG done 8 hours later is shown below (#2) and shows some terminal T inversion in V3, consistent with the positive trop and suggesting tight LAD occlusion but open artery (T inversions are "reperfusion T waves; an inverted T wave is a sign of an open artery and an upright T wave is a sign of occlusion or re-occlusion). Echo the next day is normal. She is diagnosed with "demand ischemia" and discharged home.

(#2)


The patient returned with another episode of syncope 15 days later. She had no other symptom except weakness; none whatsoever. She had the following EKG at 0700:

(#3)


Here there is 4 mm of ST elevation that can only be due to myocardial ischemia. If there is any doubt, then the presence of new ST elevation and T inversion in I and aVL should erase that. If there is still any doubt, the loss of R-wave amplitude in V2 and V3 should erase that as well. The inversion of the T wave in aVL and V2 suggests an open artery. However, this is a very strange looking Wellens' T wave because of the marked ST elevation.

The treating physician contacted the cardiologist immediately, but the cardiologist was not convinced, mostly because of the minimal symptoms and partly because it is not the classic morphology of anterior STEMI due to persistently occluded LAD, which should have upright T waves.

So they recorded another EKG at 0720:

(#4)


Now the ST elevation is unmistakable, even with the persistently inverted T waves. But because the patient was asymptomatic, the cath lab was not yet activated. A bedside echo suggested anterior wall motion abnormality.

Another EKG was done at 0739:

(#5)


This shows even more ST elevation. The patient was still asymptomatic. An initial troponin returned at 12 ng/ml. The cath lab was activated. There was a ruptured plaque with thrombus in the LAD, with some flow still (accounting for the inverted T waves).

Fortunately, the physicians were attentive and kept ordering frequent serial EKGs.

Learning point: some EKGs represent STEMI no matter what the symptoms, until proven otherwise by angiography.

Recommended Resources