Tuesday, December 27, 2011

Subtle Lateral ST elevation. False positive. This diagnosis is hard.

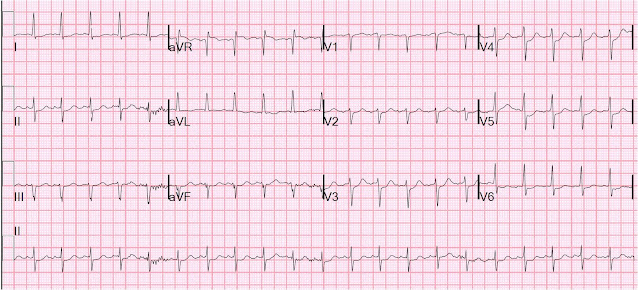
Case 1.  A middle-aged woman presented with severe substernal crushing chest pain radiating to the left shoulder.  This was her presenting ECG:
There is a Q-wave in aVL and Minimal ST elevation in I and aVL (less than 0.5 mm) in the context of a 10 mm QRS.  There is minimal reciprocal ST depression in III.  There are some features of left anterior fascicular block, but  there is not enough left axis deviation to meet criteria for this.  This could be high lateral MI with circumflex or diagonal occlusion.
Management options are to get an immediate echocardiogram, look for old EKGs (there were none), do serial ECGs, or just do an immediate angiogram.  The interventionalist was consulted and he opted to go for immediate cath.  It was negative.

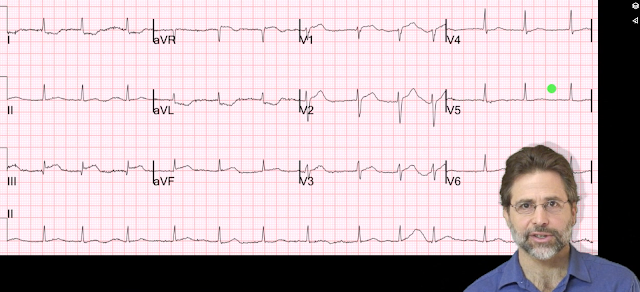
Below are 3 typical cases (cases 2-4) of lateral ST elevation with inferior reciprocal ST depression that were actually circumflex or diagonal occlusions.  In these cases, the findings are not as subtle as in case 1.  But when you look at the last case (case 5), you'll see how subtle real occlusion can be.  

It is important to remember that only about 50% of lateral MI due to coronary occlusion have significant ST elevation, and for this reason the lateral wall is often called "electrocardiographically silent."  Often this is due to low QRS voltage in lateral leads, and because ST elevation is always proportional to the QRS, the ST eleavtion is low voltage.  (See Schmitt et al. Chest 2001;120(5):1540-6, free full text)

Case 2.
Acute Circumflex occlusion (also old inferior MI with Q-waves, and early repol giving anterior STE)

Case 3.
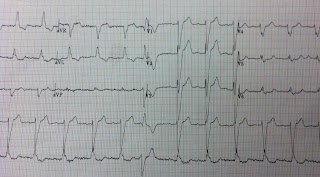
Lateral STEMI with very low voltage QRS in aVL, therefore very low voltage STE in aVL, but best seen by marked ST depression in inferior leads.  Diagonal occlusion.  Remember ST depression in inferior leads is not inferior ischemia, but rather reciprocal to lateral STEMI
Case 4.
Circumflex occlusion with hyperacute T wave in aVL and reciprocal inferior ST depression.  Notice the precordial ST depression of concomitant posterior STEMI.


Case 5a.
D2 occlusion, lateral MI


Case 5b.
After nitroglycerine, inferior ST depression and STE in aVL resolve.  D2 is open by the time of angiography.

Here is one of the most popular posts of all time, also relevant to this:  ST depression does not localize: 2 cases of "inferior" ST depression of high lateral STEMI. 

Monday, December 19, 2011

Ventricular fibrillation on a 12-lead ECG

A 54 year old male suddenly collapsed.  He had not complained of symptoms prior to this.  He received bystander CPR, then was defibrillated when the medics arrived.  He arrived in the ED awake. The following ECG was recorded:
There is sinus tachycardia with diffuse ST depression (I, III, III, aVF, V2-V6), with obligatory ST elevation in aVR (ST depression maximal in leads II and V4 establishes the ST vector as upward and rightward; there must be ST elevation in aVR).

This is typical of NonSTEMI with ischemia from acute 3-vessel ischemia or left main stenosis.  It establishes ongoing ischemia, though sometimes may be residual after cardiac arrest.  So a repeat ECG should be done a short time later in order to establish whether there is, indeed, ongoing ischemia.  Thrombolytics are never given for such an ECG, but angiogram and PCI are indicated if medical therapy alone does not control the ischemia.

Amiodarone 150 mg was given, along with aspirin, heparin, and eptifibatide.  Because of tachycardia and thus a risk for cardiogenic shock, no beta blocker was given.  BP was adequate and so nitroglycerine drip was started.  Clopidogrel (or any thienopyridine) was not used because the ST elevation in aVR makes the probability of CABG high.

15 minutes later, the patient was awake enough to take a history.  He stated that he had ongoing chest pressure, strongly suggesting ongoing ischemia.  The leads were placed for a repeat 12-lead ECG, and we were talking to the patient when the ECG tech said, "Hey, guys, uh......"  We looked up and this is what we saw:

12-lead ventricular fibrillation.  Not seen very often!!  Notice how similar ventricular fibrillation is to torsadeBy the way, the computer read: sinus tachycardia with frequent multiform PVCs!!!!


The patient was awake but becoming obtunded when he was defibrillated successfully with one shock; he did not remember it.

Recurrent v fib in the setting of ischemia is diagnostic of ongoing and uncontrolled ischemia.  The only way to control this is with PCI, if angiogram shows a lesion amenable to therapy.

A second 150 mg dose of amiodarone was given.

Angiogram showed 3-vessel disease and 3 lesions in the LAD which were stented.  He did well.

Saturday, December 17, 2011

Right Ventricular MI seen on ECG helps Angiographer to find Culprit Lesion

This is a video I made a while back.  I thought it was worth a re-post.  For those who don't have time to watch a video, you'll have to read the ECG as shown on this still frame because I lost it and cannot post it.

See down below for explanation if you don't want to watch the video.

There is inferior STEMI.  But there is also ST elevation in leads V1 and V2.  When you see this, think right ventricular (RV) MI.  The hypotension is further evidence for RV MI.  There was no right sided ECG.

I heard about the case, and saw the ECG, shortly after the patient left for the cath lab.  I called the interventionalist while the patient was on the table and he told me that the occlusion was not in the proximal RCA, but further down.  I asked if he was sure about this, because the ECG would indicate a proximal RCA occlusion with RV MI.  He took another look and realized that the culprit was indeed in the proximal RCA and that the thrombus had embolized distally.  And so he put the stent in the proximal RCA.

Learning point: Even when you have an angiogram, the ECG findings make a difference.


Tuesday, December 13, 2011

This ECG is nearly pathognomonic. What is it?

A 45 yo male with a known history of MI presents with a few hours of chest burning, resolved now.  Here is his presenting ECG:
There is ST elevation in precordial leads.  What is the diagnosis?  See below.  The first troponin I returned positive at 0.467 ng/ml.


This is classic Left Ventricular Aneurysm morphology, otherwise known as persistent ST elevation after old MI.  There are QS-waves in V2-V4 (QS-wave is a single negative deflection without any R-wave), moderate ST elevation, T-waves are not tall and may be (as in this case) slightly negative.

"LV aneurysm" morphology is so-called because it is associated with an anatomic aneurysm about 80% of the time.  It is quite common after a completed MI (formerly known as transmural MI), one in which the artery did not reperfuse, nor was the affected wall reperfused by collaterals, so the entire wall is infarcted, throught the full thinkness.    Over time, the scar thins out and bulges outward in diastole (diastolic dyskinesis on echo).  Before the reperfusion era, they were the most common reason for ST elevation STEMI mimic, but now they are much less common than before.

LV Aneurysm can be inferior, anterior, or posterior.  I have never seen a lateral LVA, but I suppose they could exist.  Inferior aneurysm looks very much like acute MI because it does not get QS-waves, but rather QR-waves, which can also be present in acute MI.  I will post a case of inferior aneurysm soon, but here is one.

The chest pain with troponin elevation establishes this as a Non-STEMI.  There is no need to activate the cath lab emergently.  In his case, next day echo confirmed apical and anterior dyskinesis, and he underwent risk stratification with a nuclear stress test, which was normal, and he did not undergo cath.  [This is perfectly appropriate conservative care for NSTEMI if the patient is discharged on maximal medical therapy (statins, beta blockers, aspirin, clopidogrel)].

Here is an old post from 2009 that describes LV aneurysm in detail, and describes an ECG rule I developed to help differentiate it from STEMI.

Here are all the cases I have posted on LV aneurysm.

Friday, December 9, 2011

Subtle Inferoposterolateral OMI, sent home!!

This ECG comes from Tom Bouthillet, who is devoted to good STEMI care, runs the EMS12lead ECG site, and who has also produced an outstanding iPhone/iPad/Android 12-lead ECG challenge App for learning to recognize subtle STEMI and to differentiate STEMIs and look alikes.

Case 1. This was a 70 year old woman who had chest pain while exercising the day before, then developed chest pain on the day of the ECG and called 911.  Here was her prehospital ECG.
There is very subtle ST elevation in inferior leads, with hyperacute T-waves, with subtle reciprocal ST depression in I and aVL, and T-wave inversion in aVL.  There is minimal ST depression in V2.  T-waves in V5 and V6 are perhaps a bit hyperacute, too.
This is diagnostic of inferoposterior OMI

For contrast, let's look at limb leads and V4-V6 side by side with a normal ECG:
Here the contrast in T-wave size is obvious. Normal has a wide range, and not all normal inferior T-waves are this small.  But the ones on the left are clearly too large.
Here the contrast in T-wave size is obvious. Normal has a wide range, and not all normal V4-V6 T-waves are this small.  But the ones on the left appear too large.

The medics did not see this.  The computer did not see this.  The patient was brought to the ED and discharged after ED evaluation.  Unfortunately, we do not have any ED data on this case.  What did the ED ECG look like?  Was there an old one for comparison?  It is hard to imagine that this was a baseline ECG.

I suspect this was a missed OMI.  Most patients with missed OMI at least get admitted to the hospital for a rule out.

Case 2. Here is a similar case in which all the data is available:


A 65 year old woman with no previous cardiac history presented with 2 hours of typical chest pain.

There are inferior hyperacute T-waves, some minimal ST depression in V2, and lateral hyperacute T-waves.  There is 0.5 mm of ST depression in aVL. 
This is diagnostic of inferoposterolateral OMI.


Here is the patient's previous ECG:
It is not entirely normal, but there are no large T-waves anywhere.  This establishes that the presentation ECGs findings are new.

These findings were also not recognized.  The patient was admitted to the CCU.  Troponin I peaked at 63 ng/ml 14 hours later.  Angiography showed an occluded dominant left circumflex.  Echo showed an infero-postero-lateral wall motion abnormality and EF of 55%.

Learning points: Scrutinize the ECG for T-wave size and morphology, especially in reciprocal leads III and aVL.

Sunday, December 4, 2011

Several Cases of ST Elevation from Early Repolarization

As I have pointed out in other posts, I have developed an equation to help in the electrocardiographic differentiation of anterior early repolarization from anterior STEMI.  If the equation [(1.196 x ST Elevation in mm at 60 ms after the J-point in V3) + (0.059 x computerized QTc) - (0.326 x R-wave Amplitude in mm in V4)] has a value greater than 23.4, vs. less than 23.4, it is quite sensitive and specific for LAD occlusion.

Remember: when you are uncertain, look for old ECGs, do serial ECGs, then, if you still need to, you can get an immediate echocardiogram, and if you ultimately cannot be certain that it is not STEMI, then you may have to risk a false positive cath lab activation. That happens.

Case 1.  One of my partners phoned me when I was out.  He was worried about this ECG.  He used his iPhone to photograph it, then sent it to me by text message:


Computerized QTc was 391 ms, STE at 60 ms after the J-point is 2 mm, R-wave is 11.5. I looked at it at said I do not think it is STEMI.  If you apply the equation, the value is 21.7 (less than 23.4, so it is early repolarization).
 I told him that it is very unlikely to represent STEMI.

Here is a previous ECG from one year ago:
The new one looks different from this one, especially in V3, but this can happen in early repol
 This was recorded the next AM, after the patient had ruled out with serial troponins:

Here are all 3 side by side:

Case 2.
A Hennepin residency graduate called me to ask about an ECG.  I happened to be in the ED so I asked her to fax it.  She was worried about diffuse ST elevation and whether there was MI or pericarditis.

There is 4 mm of STE at 60 ms after the J-point (2.5 mm at the J-point) in V2, so it looks scary.  There is 1 mm STE in 2 consecutive of inferior and lateral leads.  So it meets "criteria" for fibrinolytic therapy in every coronary distribution.  But the computerized QTc is 370 ms, the STE at 60 ms after the J-point in V3 is only 2mm, and the R-wave in V4 is 19 mm.  Equation value is 21.08, so this is unlikely to be an anterior STEMI.  Is it lateral or inferior STEMI?  The pronounced J-waves make early repol in inferior or lateral walls much more likely than STEMI.  The absence of reciprocal ST depression in aVL makess inferior MI extremely unlikely.
 As for pericarditis: the ratio of ST elevation to T-wave in V6 is less than 25 percent, so pericarditis is unlikely.  Furthermore, there is no significant PR segment depression.

Case 3.  A 19 yo with stab wound to the chest.  After viewing the ECG, there was concern for LAD laceration.

Again, there is scary ST elevation.  In fact, the ST segments in V2 and V3 are straight, not concave.  In my study, I excluded ECGs with non-concave (straight or convex) ST segments because they are so specific for STEMI.  Nevertheless, if you apply the equation, the value is only 20.52.   The patient ruled out.  The heart was not affected by the stab wound.


Tuesday, November 29, 2011

Atrial Flutter Mimicking ST Depression

A 65 year old presented with altered mental status and had an intracranial bleed:
One could be fooled into thinking this is sinus tachycardia (with a short PR interval) with diffuse ST depression.  But close inspection reveals flutter waves.  In particular, a totally upright p-wave in V1 is very unusual and should alert you to atrial flutter.  The fluttering baseline accounts for the apparent ST depression, although I cannot rule out some amount of true ischemic ST depression.


 Here is the ECG after cardioversion:
Now there is sinus.  Interestingly, this one also has an upright p-wave in V1 - so the rule is not universal!

Friday, November 25, 2011

Osborn Waves and Hypothermia

Case 1.  Temperature 30 degrees Celsius (86 degrees F) due to environmental hypothermia.

There is very slow atrial  flutter (rate = 167) with 4:1 AV conduction.  There is a wide QRS with a very large notch (in this case, a hump), or J-wave, at the end.  This is the classic Osborn wave of hypothermia.


click on ECGs for better resolution

Case 2. A young paraplegic presented confused.  Among the early tests performed was this ECG which was showed to me:

Sinus rhythm.  Long QTc [about 500ms; the computer read 180ms (!)].  There is ST elevation which alarmed the residents.  I did not think it looked like injury.  There are J-wave notches at the end of the QRS, particularly in V3, which are rather large for early repolarization, which should make one think they may be Osborn waves.

I asked about the temperature.

Here is the patient's previous ECG:

No ST elevation, and much smaller J-wave notching, seen best in V4.


A rectal temperature was 30.8 degrees Celsius.

Here is the ECG after rewarming:

J-wave notching persists but is much smaller.


Here they are side by side to better see the difference:
The J-waves are subtly larger in the hypothermic condition

The ECG in hypothermia

Rhythm: The most common rhythms in hypothermia are sinus bradycardia, junctional bradycardia, and atrial fibrillation.  Shivering artifact is common.  Atrial flutter is seen in case 1.  At temperatures below 30 C, the patient is at risk for ventricular fibrillation.   In this study of 29 humans cooled to 28-30 C for cardiac surgery, 19 developed atrial fibrillation and 2 ventricular fibrillation.

QRS: Osborn waves are thought to be pathognomonic of hypothermia, but can also be seen in normothermic patients.  "J-waves" or "J-point notching" is very common in early repolarization.   Very narrow Osborn waves were reported in severe hypercalcemia (level 16.3).  Sometimes a short ST segment of hyperCa can be misinterpreted as an Osborn wave (see image below); that is not the case in the aforementioned case report.   J-wave syndromes are proposed to give a unifying pathophysiology to Osborn waves of hypothermia and early repolarization, as well as Brugada syndrome.

Very large and wide J-waves, as in case 1, are almost exclusively due to hypothermia.  The etiology is beyond the scope of this blog, but may be read here.  

Hypothermia and pseudoinfarction patterns: MI or ischemia (either ST elevation or depression) may be mimicked either by 1) repolarization abnormalities (As in Case 2, with ST elevation) or by 2) confusing the J-wave with the ST segment, as in this case in JACC (full text) and this case in Archives of Internal Medicine (no full text).  This latter case also has ST segment depression as a repolarization abnormality.
 

Short ST segment (with resulting short QT interval) of hypercalcemia mimicking Osborn waves

 
This image courtesy of Dr. K. Wang from his Atlas of Electrocardiography.  The major difference between the Osborn wave and the example of hypercalcemia is that the Osborn wave is followed by an ST-T complex, while the wave directly following the QRS in hypercalcemia is the T-wave itself.


Saturday, November 19, 2011

Tachycardia with Pericardial Effusion

A 52 year old man with a history of atrial fibrillation and prosthetic mitral valve replacement just 11 weeks prior presented with a complaint of a rapid regular heart rate; he could hear rapid clicking of his valve.  He was otherwise asymptomatic.  His medications included amiodarone for rhythm control of his atrial fibrillation.  This ECG was recorded:
The treating physicians diagnosed sinus tachycardia at a rate of 127.  They were worried about ST elevation in II, III, and aVF, with reciprocal ST depression in I and aVL.  With the Q-waves, they were not sure if this was old or new ST elevation.


They looked for a previous ECG and found this:
There was no ST elevation at baseline.  They were now worried about acute MI.


They did a bedside echocardiogram and found a large pericardial effusion.  BP was stable and normal at 110/83.  They infused a liter of normal saline, and the heart rate remained 127.  A repeat ECG was identical.


70 minutes after arrival, the first troponin I returned elevated at 0.160 ng/ml.  Now they were even more worried about MI. 


What is the diagnosis?

Slow Atrial Flutter with 2:1 conduction.  Slow because of the beta blocking effects of amiodarone. 

1.  Note the flutter waves in V1: one positive wave that appears to be a p-wave and another that immediately follows the QRS.  The one that looks like a p-wave is positive, whereas the p-wave on the previous ECG is negative!
2.  Any time the heart rate remains the same, in spite of time or fluids, it is almost certainly not sinus.
3.  There is no ST Elevation.  All of the apparent ST elevation is due to the baseline formed by the atrial flutter waves!

INR returned at 3.9.  The patient was given propofol and electrically cardioverted in the ED.  Here is the subsequent ECG:


Final diagnosis: Atrial flutter with pericardial effusion due to myocarditis due to postoperative Dressler's syndrome.  Troponin elevation from demand ischemia.  ST elevation from flutter wave.  The effusion disappeared with time; no surgery or drainage was necessary. 

Wednesday, November 16, 2011

Anterior ST elevation: is it STEMI?

I received a call from an outside hospital.  A 31 year old healthy auto mechanic had a prolonged exposure to Carbon Monoxide in his garage and presented with blunted level of consciousness and chest pain.  There were others who were also affected.

I requested a transfer so that he could undergo immediate hyperbaric oxygen therapy at our hospital.  After the ambulance left the other hospital, the physician called to state that the patient was having an anterior STEMI with "tombstones."

The CO level returned at 14, so I knew that any STEMI would be due to simultaneous and incidental acute coronary thrombosis, NOT due to the CO toxicity.  I asked him to immediately fax the ECG, which is shown here:
What is it?


There is an R'-wave in V1 with downsloping ST elevation and an inverted T-wave.  There is ST elevation in lead V2.  This is not STEMI.  It is Brugada pattern

Brugada is frequently mistaken for STEMI, although it can also mask anterior STEMI.  I was not worried about this ECG.  When the patient arrived, his Brugada pattern had resolved: 


There is minimal STE and poor R-wave progression, but the QTc is 384, so this is early repolarization.  The Brugada pattern is gone.

We sent him to the chamber.  He was admitted to the hospital and ruled out for MI.  The patient's CO level was only 14, but he had had a prolonged exposure, had enough toxicity to cause objective neurologic deficits, and the blood level had been measured after prolonged oxygen therapy.

Brugada pattern ECG is not Brugada syndrome, which requires more than simply an ECG.  It is important to note that the pattern and the risk for cardiac arrest may not always be present, but may be induced by fever or sodium channel blocking drugs.  This makes me wonder if CO poisoning could induce or unmask Brugada pattern on the ECG.

Also, V2 makes this Brugada pattern atypical.

The patient should be referred to an electrophysiologist.

Friday, November 11, 2011

Hyperacute T-waves, with a Twist

A 30 year old male complained of chest pain and then collapsed.  He was resuscitated from ventricular fibrillation.  He arrived at 0700.

These two ECGs were recorded at 17 minutes apart.

Which was first?

There are hyperacute T-waves in V1-V5, with some depressed ST takeoff in V3-V5.  There are also hyperacute T's in II, III, and aVF

There is ST elevation (injury) in V2-V4and II, III, aVF


The bottom one was recorded first, at 0719, the top one was recorded second at 0736.  The patient's artery had reperfused between the first and the second.

This illustrates nicely how hyperacute T-waves are present not only shortly after occlusion, but also shortly after spontaneous reperfusion, or, as I sometimes say: "both as the ST segments are on the way up, and on the way down."

As it turns out, the artery reoccluded, and at 0801, the angiogram showed a 100% occluded type III ["wraparound" (to the inferior wall)]  mid (after the second diagnoal) left anterior descending artery.  A large  thrombus was aspirated and the LAD was stented.

The EF later that day was 25%, with both inferior and anterior wall motion abnormalities.  However, as expected from the short duration of complete occlusion, the troponin I peaked at only 20 ng/ml.   A second Echo was done 4 days later:  the stunned myocardium had recovered, and the EF was 65%.

He underwent therapeutic hypothermia and in spite of some initial hypoxic encephalopathy, he completely recovered.

Click here to see the most popular post of all time, on hyperacute T-waves.

Wednesday, November 9, 2011

Atrial Repolarization Wave Mimicking ST Depression

A 25 year old woman presented with a caffeine overdose and chest discomfort.  This is her ECG:
There is sinus tachycardia (rate = 120) with what appears to be diffuse ST depression in leads II, III, aVF and V2-V6.  However, if you look closely, the PR segment is downsloping.  This is due to a pronounced negative atrial repolarization wave (atrial T-wave, or "Ta-Wave").  The wave is still negative at the J-point, and thus depresses the J-point.  

The ST segment is most commonly measured at the J-point and relative to the PR segment, but when there is a Ta-wave, this method is inaccurate.  K. Wang (my mentor) recommends measuring the ST segment relative to the end of the PR segment (this is also called the PQ junction, and the recommended location for measurement according to ACC/AHA)  However, in my experience, when there is a Ta-wave, the PR interval is still downsloping at this point and this method of measurement will underestimate the effect of the Ta-wave.  Also, in my experience, and contrary to research I outline below (and which contradiction I cannot explain), the greatest part of the Ta-wave is back to baseline by 60-80 ms after the J-point. In the case above, if you measure the ST deviation at 60-80 ms after the J-point and relative to the TP segment, you'll see that there is no ST depression.

Many textbooks recommend measuring the ST segment at 60-80 ms after the J-point and relative to the TP segment, presumably because it helps to avoid the issue of the Ta-wave.  However, especially in tachycardia, the TP segment may never come back to baseline after the T-wave; furthermore, the T-wave has often begun by 80 ms after the J-point, as in this case.

Below is a schematization of the Ta-wave:

The atrial  repolarization wave lowers the baseline, but its amplitude, if present at all, is not great (maximum 0.2 mV, or 2 mm at normal recording).  It is not finished until up to 180 ms after the J-point (see references below).   

How do you recognize the Ta-wave?  First, you have to be aware of it and look for it.  Then, you have to imagine a curve, like this drawing:
The Ta-wave inscribes a parabolic curve that can be imagined when viewing the ECG


Learning point: Beware diagnosing ST depression before considering the atrial repolarization wave as the etiology.

More Detail on the Ta-wave:

The Ta-wave is a mean of 320 ms after the end of the p-wave, with a duration of 2-3x that of the p-wave and a polarity always opposite of the p-wave.  The PTa duration (onset of p-wave to end of Ta-wave) is a mean 440 ms, though it varies with heart rate just like the QT interval.  Thus, if the PR interval is 160 ms, the Ta-wave ends about 280 ms later.  If there is normal conduction of 100 ms, the Ta-wave may still be present at 180 ms after the end of the QRS!  Even if the patient has Bundle Branch Block with a duration of 140 ms, then the Ta-wave may still be present 140 ms after the end of the QRS. 

Here is a short explanation of the atrial repolarization wave.

Here are two detailed articles measuring the Ta wave: one by Holmquist et al. and another by Debbas et al.


Friday, November 4, 2011

Left Bundle Branch Block (LBBB) with Chest Pain, concordant and excessively discordant ST depression V2-V6

A middle-aged male presented pain free after an episode of chest pain.  Here is the initial ECG (sorry some is cut off -- it is an iPhone shot from a friend):

There is LBBB with appropriate discordance of all ST segments.  Anterior ST elevation is appropriate, with highest ST/S ratio of 3.5/28 = 0.125 (mean normal = 0.11; normal up to 0.19).  There are concordant T-waves in V5 and V6.  This is a nonspecific sign of NonSTEMI.
 5 minutes later, the patient had crushing chest pain, and this ECG was recorded (again, some of limb leads are cut off):
Now there is concordant ST depression in V2 and V3.  This is a relative change of approximately 5 mm(!).   There is excessively discordant ST depression in V4-V6.   (V4 ratio is 2/6 = 0.33; V5 ratio = 2.5/6.5 = 0.38;  V6 = 2/6.5 = 0.31).  Thus, there is ischemic ST depression in V2-V6.   In normal conduction, ST depression from V2-V6 is often due to subendocardial ischemia, whereas when limited to V1-V4, it is usually posterior STEMI.  Either way, this is a patient with acute coronary syndrome with chest pain.  If you cannot control the symptoms with medical therapy, then the patient must go to the cath lab.   

I have written about excessively discordant ST elevation, but have not mentioned excessively discordant ST depression.  In our study of LBBB with and without coronary occlusion, just one lead with excessively discordant ST depression or ST elevation, as defined as a ratio of ST depression (or elevation) to the preceding R-wave (or S-wave), greater than 0.25, was very specific for ischemia (in our study, for occlusion).  More recent analysis of the data showed that 0.20 was probably a better cutoff.

The physician called the interventionalist, who did not agree there was ischemia on the ECG.  The patient was started on nitroglycerine IV and the pain subsided, as did the ECG findings. 

The patient was admitted pain free on nitro and no immediate cath was done.  The troponin I peaked later at 0.18 ng/ml. 

The next AM, the patient had another episode of pain that could not be resolved with maximal medical therapy.  He went for emergent cath, which showed a proximal lad 95% stenosis with deep ulcer and a 90% mid lad stenosis.  Both were stented.

Later, the troponin peaked at 5.6, and echo showed anteroseptal hypokinesis with EF <40%.

So this was LBBB with concordant and excessively discordant ST depression, representing ST depression in leads V2-V6, completely consistent with subendocardial ischemia due to profound LAD ischemia.

Saturday, October 29, 2011

Wellens' syndrome, no culprit, what happened?

A 55 yo male with h/o smoking complained of 4 days of intermittent chest pain lasting up to a few hours each day.  He presented to the ED pain free and had the following ECG at 1332:

There is a suggestion of terminal T-wave inversion in V2, highly suggestive for early Wellens' syndrome.  There is T-wave inversion in I and aVL diagnostic of ACS.

The first troponin returned with "minor increase" on a qualitative troponin I, so another quantitative troponin was sent and it was elevated at 0.325 ng/ml.  The patient remained pain free.  

Another ECG was recorded at 1555:
The T-wave inversion is more pronounced in V2, an evolution diagnostic of Wellens' syndrome.  TWI in aVL again is clearly ischemic.

See here for classic evolution of Wellens' waves.

The patient was admitted to the hospital late on a Friday, and put on antithrombotics and antiplatelet agents.  His troponin I peaked at 1.05 ng/ml that day.

On day 2, he had an echo which was suggestive of anterior wall motion abnormality.  He had no ECGs that day.

Sunday AM at 0800, he had another episode of severe chest pain, waxing and waning.  He had the following ECG recorded, and it is unclear whether he was having the pain at the time of the ECG.


Now there are deeper and more symmetric Wellens' waves.  Is this just evolution of the waves seen 2 days ago? 
Or did something new happen?


Troponin rose again that day (day 3).  So the patient was taken to the cath lab.  He had no culprit, but a 50-60% narrowing of the proximal LAD.  

Fractional Flow Reserve was performed across the lesion and it was 0.88 to 0.90 (negative, showing no blockage of flow).  

Intravascular ultrasound revealed that the lesion had a minimal luminal diameter of 2.3 mm but a large plaque burden.  Nevertheless, it did not appear to the angiographer to be the cause of the symptoms.

The patient went back to the wards.  He had an identical episode of pain the next morning (day 4).  It turns out that the patient was on an ST segment monitor and it had not been checked on day 3 after the previous episode of pain.  

So the interventionalist went and had it printed out.  Here it is, a 12-lead monitor strip:
Obvious anterolateral STEMI.

This illustrates what Wellens' syndrome is: it is always recorded when the patient is pain free, after an episode of chest pain.  The artery is always open, or the territory is supplied by good collaterals, but there is an LAD lesion that is at high risk of re-occlusion (as in this case).  

Wellens' is the aftermath of occlusion that has reperfused.  The inverted T-waves are "reperfusion T-waves."

In this case there was no clear LAD lesion.  It is uncertain whether this was spasm or a case of plaque rupture with thrombosis and complete lysis.  

However, aftert they went back and stented the LAD, all symptoms resolved, suggesting ruptured plaqe.

Wednesday, October 26, 2011

Four anterior STEMIs: acute and reperfused vs. won't reperfuse, subacute and reperfused vs. not reperfused

These 4 recent cases illustrate acute and subacute MI with reperfusion and absence of reperfusion (or failed reperfusion).  QS-waves and depth of T-wave inversion are very helpful in determining the duration of injury (the "acuteness" of the ECG), the viability of the myocardium, and patency of the infarct-related artery.  Persistence of ST elevation helps to determine state of the myocardium after reperfusion.

Definition: total loss of R-wave means there is a QS-wave (a single deep deflection).  Preservation of R-wave may mean and initial Q-wave followed by an R-wave (this is called a QR-wave.  Upper case vs. lower case Q (q) or R (r) is used to designate smaller or larger waves. 

1.  This 57 yo diabetic male presented with generalized fatigue, myalgias, and arthralgias, mild subjective fever and chills, and nausea.  He also stated his arms and head feel "heavy" and he had a headache, dry heaves, and dizziness, and some "indigestion" in his chest "like acid". His pulse was 114.  Exam was otherwise normal.
There are QS-waves in precordial leads with some preserved R-wave in V2 (Qr-wave).  There is persistent ST elevation, but no T-wave inversion. T-waves are not tall (tall, hyperacute T-waves are markers of ischemic but viable myocardium).  The fact that they are not present here suggests that the MI is complete.  That they are not inverted tells us that the artery is still closed.  But the presence of a bit of R-wave gives some hope that there might be some viable myocardium left. [STE in lateral leads, with inferior reciprocal ST depression, tells us it is a proximal LAD ]


Cath showed a 100% proximal LAD and other disease.  It was opened.  Initial troponin I was > 50 ng/ml; followups are not available.  Echo on the day after admission showed EF of 30-35% and antero-apical wall akinesis with an LV thrombus [these frequently form in complete or near complete (no early reperfusion) anterior STEMI because of akinesis/stasis]

2 more days later, this was recorded:
ST elevation is still present.  Persistent ST elevation 3 days after a nearly transmural MI portends possible LV aneurysm.
Echo at this time showed some improvement in EF to 40%, but persistent akinesis and thrombus.


2. This 42 yo diabetic male presented with cough and foot pain.  He had been awakened by cough at 3 AM 2 days earlier.  In spite of aggressive questioning, he denied chest pain, but he did tell one triage nurse that he had had some chest burning, and so he underwent an ECG:
There are deep Q-waves and QS-waves in precordial leads V2-V3, with a bit of R-wave left in V4.  ST segments are greatly elevated and T-waves are deeply inverted.  There is also T inversion in I and aVL (Proximal LAD) and a Q-wave in III.
Symptoms have been prolonged but intermittent, and there has been little chest pain, if any.  So all duration of injury must be estimated from the ECG.  Even when there is chest pain, the ECG is a more reliable indicator of injury duration than are symptoms.  Here there are some QS-waves, telling us that there has probably been a significant amount of completed infarction, but there is also persistent R-wave in lead V4 suggesting some viable myocardium.  The deep T-wave inversion also tells us that there is a significant amount of viable myocardium left and that the artery is most likely open.   It is very unlikely to be LV aneurysm morphology when the ST elevation is so high and the T-Wave inversion is so deep.

Cath showed a 95% LAD with flow.  Echo showed anterior wall motion abnormality.  Peak troponin I was 52 ng/ml (significant myocardial loss, but not the whole anterior wall)


3. This 67 yo male with h/o HTN and GERD only presented with 60 minutes of diaphoresis and GERD symptoms.  He had a prehospital ECG:
Obvious anterolateral acute STEMI
The patient received aspirin only and his pain immediately resolved:
Clear resolution of all ST elevation, with only some residual T-wave inversion in I and aVL.  The LAD has reperfused early.
An open 90% LAD was stented.  Peak troponin I was 0.3, so almost no myocardium was lost.

Here is the ECG the next AM:
There was so little infarction that there are lateral, but no anterior reperfusion T-waves (normally, there would be Wellens' type waves after LAD reperfusion).  The T-waves are smaller than they were immediately after reperfusion, illustrating how hyperacute T-waves are present BOTH shortly after occlusion (when ST segments are on the way up) and shortly after reperfusion (when ST segments are on the way down).


4. A 51 year old male with h/o stent presented with 30 minutes of chest pain:
Obvious anterolateral very acute STEMI with hyperacute T-waves
He went for immediate PCI, with successful reperfusion of a 100% occluded proximal LAD, and a door to balloon time of 35 minutes.  This was recorded 2.5 hours later, after PCI:
There is a significant QS-wave in V2, with some persistent ST elevation, suggesting incomplete small vessel reperfusion and significant infarction.
The patient continued to have ischemia after PCI, and in fact had an episode of polymorphic VT shortly after while in the ICU.   This was recorded the next AM:

There are QS-waves in V2 and V3, with rather shallow T-wave inversion, both indicative of  significant myocardial loss.
Peak troponin I was 84 ng/ml and there was a large anterior wall motion abnormality, in spite of very fast treatment and a symptom onset to balloon time of 65 minutes.

Sometimes, even with very fast reperfusion, there is significant myocardial loss because of downstream obstruction of small vessels.  This can be seen on angiogram as an absence of "myocardial blush" and is measured the the TIMI myocardial perfusion grade (TMP grades 0-3, just like TIMI flow grades 0-3).

As it turns out, the best measure of reperfusion is TMP (not TIMI flow) and the best noninvasive measure of TMP is the ECG, as measured by resolution of ST elevation on the ECG ("ST resolution"), with 70% resolution associated with high TMP grade.  The ECG, as it turns out, is the best predictor, better the TMP grade because TMP measures microvascular patency, and the ECG measures cellular viability (see this full text article and this abstract).


I will specifically discuss acuteness on the ECG in a future post.


Here is some older but very interesting literature on TIMI myocardial perfusion grade and ST resolution:

1.  Claeys MJ, Bosmans J, Veenstra L, et al. Determinants and prognostic implications of persistent ST-segment elevation after primary angioplasty for acute myocardial infarction: importance of microvascular reperfusion injury on clinical outcome. Circulation 1999;99(15):1972-7.
2. Gibson CM, Cannon CP, Murphy SA, et al. Relationship of TIMI myocardial perfusion grade to mortality after administration of thrombolytic drugs. Circulation 2000;101(2):125-30.
3. Shah A, Wagner GS, O'Connor CM, et al. Prognostic implications of TIMI flow grade in the infarct related artery compared with continuous 12-lead ST-segment resolution analysis.  Reexamining the "gold standard" for myocardial reperfusion treatment. J Am Coll Cardiol 2000;35(3):666-72.
4. van't Hof AW, Liem A, de Boer MJ, et al. Clinical value of 12-lead electrocardiogram after successful reperfusion therapy for acute myocardial infarction.  Zwolle Myocardial Infarction Study Group. Lancet 1997;350(9078):615-9.
5. van't Hof AW, Liem A, Suryapranata H, et al. Angiographic assessment of myocardial reperfusion in patients treated with primary angioplasty for acute myocardial infarction: myocardial blush grade.  Zwolle Myocardial Infarction Study Group. Circulation 1998;97(23):2303-6.


Recommended Resources