Wednesday, June 21, 2017

Patient presentation is important, and so is R-wave amplitude

Two Histories, One ECG


Story number one:

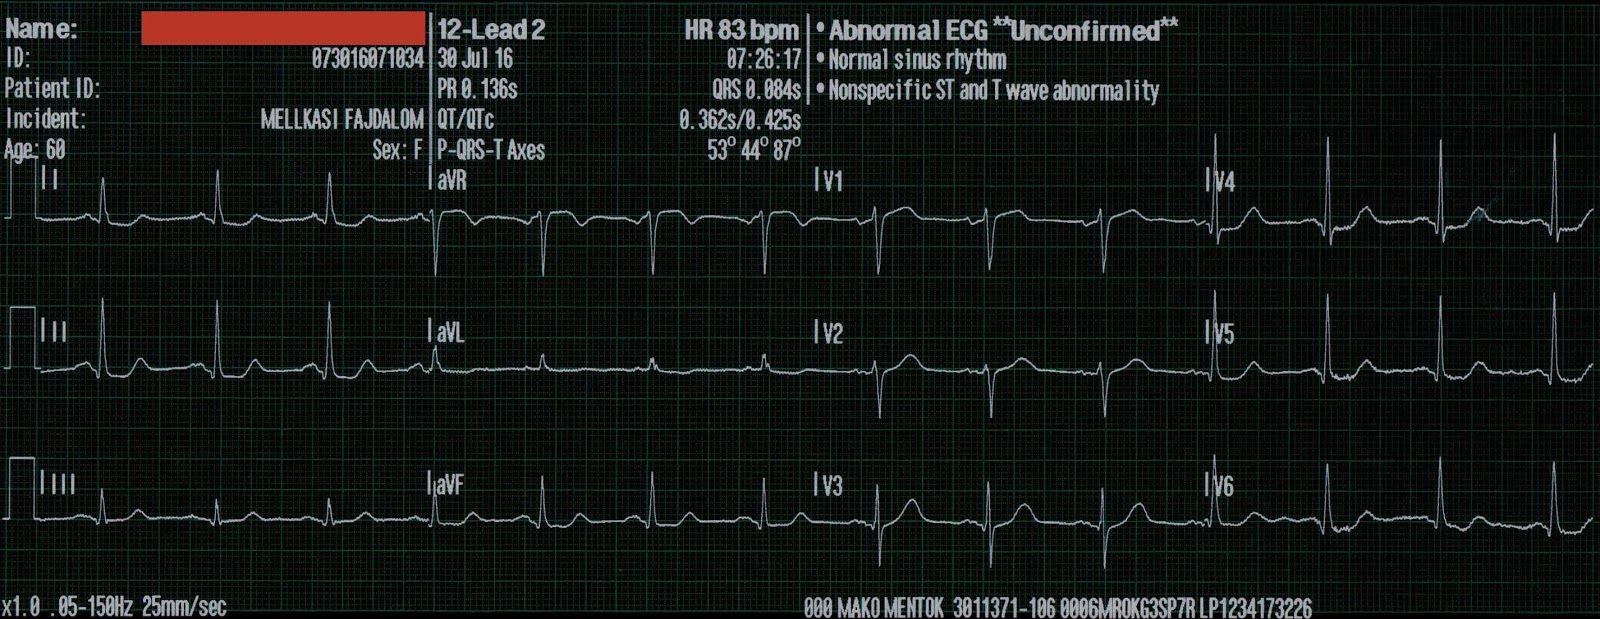
An athletic 20-something presents with chest pain and has this ECG at triage:
QTc = 362 ms
What do you think?


In a 20-something, this is a tough ECG.  Is it anterior MI?

Being young does not rule it out: 

An intoxicated, agitated, 20-something with chest pain


There is sinus bradycardia at a rate of 44.

There is 2 mm of ST elevation in V2 and V3 (at the J-point, relative to the PQ junction), which is below the "criteria" for men under 40 (2.5 mm).

There is upward concavity
There is no ST depression
There are no Q-waves
There is no terminal QRS distortion

So early repolarization is a possibility.

However, there is very suspicious STE in III and aVF, with ST depression in aVL.    To me, this makes the ECG nearly diagnostic of ischemia, though if it is LAD occlusion, there should be ST depression in III and aVL, so it is a bit confusing.  Unless you consider a wraparound LAD. 

There is also an upright T-wave in V1, larger than V6.  This is a very soft sign of LAD occlusion, and did not add any diagnostic improvement over our formula model for diagnosing LAD occlusion vs. early repol.  In that study, this finding was present in 39% of LAD occlusion and 15% of early repol.

What do the formulas have to add?
Computerized QTc
RAV4 = R-wave amplitude in lead V4
STE60V3 = ST Elevation relative to the PQ jct at 60 ms after the J-point
QRSV2 = total QRS amplitude (Q, R, and S) in lead V2

The 3-variable formula is: 
(1.196 x STE at 60 ms after the J-point in V3 in mm) + (0.059 x computerized QTc) - (0.326 x R-wave Amplitude in V4 in mm).

The 4-variable formula is: 
(1.062 x STE at 60 ms after the J-point in V3 in mm) + (0.052 x computerized QTc) - (0.151 x QRSV2) - (0.268 x R-wave Amplitude in V4 in mm).

 In its derivation study, the 4-variable formula performed better than the 3-variable formula, with an AUC of  0.9538 vs. 0.9686, and was both more sensitive and specific.

Driver BE and Smith SW: A new 4-variable formula to differentiate normal variant ST segment elevation in V2-V4 (early repolarization) from subtle left anterior descending coronary occlusion - Adding QRS amplitude of V2 improves the model

Both formulas can be calculated at this link on an excel applet:
http://hqmeded-ecg.blogspot.com/p/rules-equations.html

The measurements are:

RA V4 = 6.5
STE60V3 = 3.0
QRSV2 = 12.5
QTc = 362 ms

The formula values are thus:

3-variable: 22.83 (less than 23.4; the most accurate, but not most sensitive, cutoff).  I still worry when the value is above 22.0 (still misses 4% of LAD occlusion when below 22.0)

4-variable 18.38 (greater than 18.2; the most accurate, but not most sensitive, cutoff). So this is strongly indicative of LAD occluson.

Computerized QTc = 362 ms (this is VERY short for LAD occlusion, but is so short because of correction for slow heart rate; the measured QT was 413 ms.)  This is the main reason the formula value is not very high.

Thus, the ECG is early repolarization by the old formula and is LAD occlusion by the new one.

Even though the ST Elevation is not diagnostic, and T-waves of this size can be seen in early repolarization, but low QRS and R-wave amplitude is not.

The inferior ST findings also make this ECG diagnostic.

In case you were wondering about the T-waves and bradycardia, the K was normal.

Why bradycardia?  Think about that inferior ST elevation.  Maybe there is also inferior MI from wraparound LAD with associated sinus bradycardia.


Story number 2: the real story

I was at triage when a 60-something man who had history of elevated cholesterol and hypertension appeared, clutching his chest, diaphoretic and pale, stating he had had sudden onset of substernal CP 30 minutes prior.

I looked at him and thought to myself: "this man is having an anterior MI".  I almost activated the cath lab without an ECG, but we recorded one within 1 minute of arrival.

Here is that same ECG again:

I actually only saw lead V2 on the screen of the machine when I activated the cath lab.  It had not yet even been printed out.

14 minutes later, just before going to the cath lab, the patient's pain went from 10/10 to 7/10.

Another ECG was recorded:
The T-waves in V2 and V4 are slightly smaller

The patient went to the cath lab:

A large proximal LAD thrombus with TIMI-1 flow was found.  Thus, there had been some minimal spontaneous reperfusion (autolysis).  It was a wraparound LAD, explaining the inferior ST elevation with reciprocal ST depression in aVL (the opposite of what you expect with a proximal LAD occlusion).  It was stented.

The post-cath ECG is here:
ST elevation is resolved.
T-waves have normalized
There is T-wave inversion in III with resolution of ST elevation.

The cardiologists were not impressed by the ECG.  This is the cardiology note:

"Pt's ECGs were not convincing but presentation was extremely concerning for ACS."

Summary

So this was an anterior and inferior STEMI due to an LAD that wraps around to the inferior wall. We do not see evidence of the ischemia of the first diagonal (which is distal to the occlusion and usually is revealed by STE in I and aVL).  This is because that STE was cancelled out by reciprocal ST depression due to the inferior STE.  The sinus bradycardia may be due to the inferior wall ischemia, although this happens primarily when there is occlusion of the RCA.

The 4-variable formula was correct.

The door to balloon time was 57 minutes.

This was recorded the next day:
Now there are Wellens' waves (terminal T-wave inversion), although with a poor R-wave.
The poor R-wave suggests quite a bit of anterior infarction, probably permanent.

Peak cTnI = 51 ng/mL

The echo next day showed:

The estimated left ventricular ejection fraction is 63 %.
Regional wall motion abnormality-distal septum anterior and apex akinetic
Regional wall motion abnormality-distal inferior wall .
Left ventricular hypertrophy concentric .
Regional wall motion abnormality-anterior akinetic.


Learning Points:

1. The pretest probability is important
2. R-wave amplitude is important
3. The 4 - variable formula is more accurate than the 3-variable
4. Look at the inferior leads.
5. Remember that a wraparound LAD can hide the findings of a proximal occlusion.


Monday, June 19, 2017

de Winter's T-waves evolve into Wellens' waves

This comes from a paramedic in Hungary named Farkas László:

This patient had chest pain that then resolved:
There is diffuse ST depression, with ST Elevation in aVR and a hyperacute T-wave in lead V3
V3 is likely a de Winter's T-wave (ST depression with large upright T-wave)

Since this T-wave is not obviously massive, one might think this is a posterior MI (right precordial ST depression) or simply diffuse subendocardial ischemia (diffuse ST depression with STE in aVR).

11 minutes later, the chest pain was gone, suggesting spontaneous reperfusion (autolysis of thrombus).  

This ECG was recorded:
All ST depression in V3 is gone
Only residual ST depression remains
The T-waves in V2 and V3 are smaller
This rules out posterior MI: as an artery reperfuses in posterior MI, the T-wave gets larger!
(Posterior reperfusion T-waves)

See posterior reperfusion T-waves: 

2 Examples of Posterior Reperfusion T-waves


Here is our research on this topic: http://emj.bmj.com/content/34/2/119
8 minutes later:
All precordial T-waves are smaller still


7 minutes later:
There is less ST depression


Another 16 minutes later:
There is new ST elevation, but, in addition, Wellens' waves are emerging (Wellens' pattern A, terminal T-wave inversion in V2-V4, and a little in V5)
This is still more evidence that the LAD is the infarct-related vessel.


Another 7 minutes later
ST Elevation is resolving, terminal T-wave inversion remains

Here is a .gif of lead V4 from T = 0-11-19-26-42-49 minutes:


The cath lab was activated and a 90% thrombotic subtotal occlusion with flow was found.

I think that de Winter's T-waves really represent very tight subtotal occlusion of the LAD.  Complete occlusion results in ST Elevation.  Very tight stenosis results in subendocardial ischemia with diffuse ST depression and STE in aVR.  de Winter's is a point halfway between these two: a hybrid of STEMI and diffuse ST depression with STE in aVR.

Here is another example of this:


Is the LAD really completely occluded when there are de Winter's waves?


Of course, when the LAD reperfuses, we usually get Wellens' waves (reperfusion T-waves).  So even though the ECG never manifested outright STEMI, the small amount of infarct that resulted from this subtotal occlusion resulted in the same T-wave evolution that we would have seen with outright STEMI.


Saturday, June 17, 2017

Slightly Peaked T-waves. What is it?

 I saw this as I was reading a large a stack of ECGs:
What do you think?


There is sinus tachycardia.  The T-waves are slightly peaked, suggesting hyperkalemia.  But what is atypical is that the T-wave in V3 towers over the R-wave.  

And there is terminal QRS distortion in lead V3 (meaning there is neither a J-wave nor an S-wave).  The QTc is 462 ms.  Terminal QRS distortion is never seen in normal variant ST Elevation in anterior leads (so-called early repolarization)

These are suspicious for hyperacute T-waves and anterior injury.  

The formula score is 24.8 (>23.4), also consistent with anterior injury (STE60V3 = 2, QTcB = 460, RAV4 = 14.5), but terminal QRS distortion alone makes normal variant STE almost impossible and makes use of the formula particularly subject to false negatives.

The above is what I thought when I saw this, so I went to the chart and found this history:

A type I diabetic aged approximately 35 years old presented with chest pain, nausea, vomiting and diffuse abdominal pain.  The patient was in DKA with an anion gap of 35, a glucose of 1128, and a K of 5.5 mEq/L. 

pH = 7.17, pCO2 = 24, HCO3 =  8.  

Her T-waves were attributed to hyperkalemia, without further investigation.

The patient was treated for DKA and admitted.

One would not expect such profound T-wave changes from a K of only 5.5.  

The patient did have a serial troponins (they are automatically ordered on critically ill patients) and they rose to a peak of 12.4 ng/ml, which is too high for a typical critical illness without MI.  

Here is her ECG the next day (with a normal K):
T-waves are much more normal, less peaked, but also with better R-wave amplitude.  The ST segment is back to 0.  Equation value is 23.0.  There is an S-wave in V3 now, although small.

Because of the high troponin, echocardiography was done and showed a wall motion abnormality in the anterior, anterolateral, and apical walls, consistent with LAD myocardial infarction.  Therefore, she underwent angiography and had a 95% LAD thrombotic culprit that, fortunately, had reperfused on its own (that's why the troponin was only 12).  It was stented.  Had it not opened on its own, it could have resulted in a very large anterior wall MI.

The possibility of anterior STEMI was not noticed during patient care.  I noticed it much later on looking through a random stack of EKGs.  I mention this only to point out that these findings can be noticed, and differentiated from more benign etiologiesprospectively.  


This is NOT a retrospective finding.

Learning point

Hyperacute T-waves and hyperkalemia may be confused, and they may be simultaneous.  Here the potassium was barely high enough to result in a change in T-waves, so one should be especially suspicious in this case.


Wednesday, June 14, 2017

An adolescent with trauma, chest pain, and a wide complex rhythm

This case was sent by Dr Avinash Krishnamurthy, a fine emergency medicine resident from Australia Cairns base hospital


Case:

An adolescent male had a mechanical fall and injured his left shoulder and arm.  There was apparently no syncope and he had no bony injuries, but he did complain of left sided chest pain.  His chest was tender.  A bedside cardiac ultrasound was normal.

An ECG was recorded:
Avinash was understandably confused by this ECG.
He wrote:
"ECG 1 - shows wide ???IVCD type rhythm ?? Delta waves in them and then his native rhythm, with ectopic pace maker??"


This was recorded shortly after:
"Wide complex rhythm"


This was recored seconds later:
QRS are normal. P-waves are inverted with normal PR interval.  This is low atrial rhythm.

Here is my response:

The QRS morphology looks like WPW, but it can't be because there are no P-waves, and when P-waves do appear, the QRS normalizes.
I think this is accelerated idioventricular rhythm, but with a slightly strange QRS.

Accelerated idioventricular rhythm is a generally benign rhythm. It is commonly seen in the reperfusion setting.  It appears to be benign in children as well (see references below).

I sent it to my friend, Ken Grauer, who is very meticulous in his ECG reading.  He has a great blog too: ECG Interpretation

He is also well known on the Facebook EKG Club page, where you can learn tons about ECGs:


Here is his response, with the first ECG labelled:

Hello Steve & Avinash.

I agree completely with Steve — that this is AIVR with a strange-looking QRS complex. I labeled ECG. As we see in ECG #3  — the regular rhythm is NOT sinus, because the P wave is negative in lead II. The P wave is positive in lead aVL of ECG #3, which means it is a low atrial (or probably coronary sinus) rhythm — which of itself is not necessarily “abnormal” in a child if there is no other sign of underlying heart disease. 

So if we now come back to ECG #1 (directly below what I’m writing) — we can see this low atrial rhythm resume for beats #10,11,12 at the end of the tracing. The first 8 beats are AIVR — and beat #9 is a FUSION beat. You can see in simultaneously obtained lead V2 for beat #9 that this beat IS wider than the low atrial beats that followbut NOT quite as wide as beats #7 and 8 in lead V2. This makes sense, because the PR interval preceding beat #9 in the long lead II at the bottom is slightly SHORTER than the PR interval of the normally conducted low atrial beats (#10,11,12). This PROVES ventricular etiology for wide beats #1-thru-8. Sometimes (depending on the site of the ventricular rhythm) you may see initial slurring in the QRS that in some leads resembles a delta wave — but the rhythm here is AIVR.

In ECG #2 — we see the REASON why this slightly accelerated ventricular rhythm was able to “take over” — namely that there is a slight slowing of the rhythm after the 1st beat in the long lead II of ECG #2, just enough to allow the slightly accelerated ventricular rhythm to take over! 

In ECG #3, the low atrial rhythm rate becomes slight faster than the AIVR rhythm — so that’s why it again takes over.

AIVR is NOT common in otherwise healthy children. I’ve attached an article and an abstract (that article is in Japanese unfortunately … ) that do document that you CAN however on occasion find AIVR in otherwise healthy children — and I suppose that IS what we have here. Perhaps the circumstances surrounding the ED visit cause slight acceleration in the ventricular escape rate to allow this all to happen.

Here the full text of the article:

Hope that helps!

: ) Ken


Case Outcome:

The patient had never had any cardiopulmonary complaints, was otherwise completely healthy. He was admitted overnight and had no complications.  He was discharged and schedule for an outpatient echo which has not been done yet.


More literature on this:


Here are other examples of Accelerated Idioventricular Rhythm, Usually a Reperfusion "Dysrhythmia"

I saw this on the computer. Most physicians, at first glance, get this wrong. What is it?


Monday, June 12, 2017

Should Emergency Physicians be interrupted by ECGs that are read as "Normal" by the computer?

Here was a comment on Facebook about this post:

"I was hoping this post would let me off the hook for all those "normal ekg" reading and but no, they can't replace us yet..."

Here was my response:

"Be happy that you can't be replaced -- yet! Though stressful, it is good to be needed. It will be more stressful when computers replace us and we're out of work. I am working with a company that writes deep neural network software for interpreting ECGs. We're only beginning and we're already better than conventional algorithms. It is a matter of time."

This was sent by:

Jacob Smith, DO
Emergency Medicine Resident
Ohio Health Doctors Hospital Emergency Residency

Christopher Lloyd, DO, FACEP
Director of Clinical Education, USACS Midwest

Case

A 30 year old patient presents to triage with chest pain.  An ECG is recorded and the computer reads it as "normal".

Do you want to see it?

Or would you rather not be bothered?


I'd rather be bothered.

Here it is:

Computer read: "Normal ECG"
Aren't you glad that you looked at it?
Otherwise the patient could wait in triage for hours.

Unknown algorithm


Interpretation: Inferior ST elevation, with reciprocal ST depression in aVL.  This is diagnostic of inferior MI, though does not meet millimeter criteria for "STEMI."  There is also ST elevation in lateral precordial leads V5 and V6.

Years later, I sent it to the Queen:

The Queen of Hearts PM Cardio App is now available in the European Union (CE approved) the App Store and on Google Play.  For Americans, you need to wait for the FDA.  But in the meantime:

YOU HAVE THE OPPORTUNITY TO GET EARLY ACCESS TO THE PM Cardio AI BOT!!  (THE PM CARDIO OMI AI APP)

If you want this bot to help you make the early diagnosis of OMI and save your patient and his/her myocardium, you can sign up to get an early beta version of the bot here.  It is not yet available, but this is your way to get on the list.


Here is the history:

A 30 yo man presented complaining of severe chest pain.  He had a family history of early CAD and occasional drug and tobacco use.

The ECG was alarming to the ED physician who did indeed review it.  He was worried for inferior MI and ordered another, which was recorded 15 minutes later:
Now clearly and obviously diagnostic of inferior STEMI.  It is not subtle any more.

Interventional cardiology was consulted and patient was taken to the cath lab. He was found to have a 100% circumflex lesion for which a bare metal stent was placed.

Imagine if this patient had been at a busy triage and they trusted the computer interpretation.  He may have waited hours before being seen.

Comment

A recently published article (1) found that a computer-interpreted “normal” ECG has a 99% NPV (95% CI: 97-99) for a clinically significant finding. They suggest (but did not conclude) that immediate EKG review by a physician could be safely eliminated when the computer interpretation is normal.

Those confidence intervals are important.  They mean that, in reality, there is a good chance that a computer-interpreted "normal ECG" misses 3% of significant abnormalities.

This study was far too small (n = 222 "normal" ECGs) to conclude that ECGs do not need to be read by a human.

This is probably why the authors only "suggest" and do not "conclude" this.

According to 2 recent articles (2, 3), the computer misses one third of STEMI, but misses many more subtle MI that do not meet STEMI criteria.  Most of these will not be "normal" but will have nonspecific ST-T abnormalities, or other features which the computer recognizes as "abnormal" but does not diagnose.

However, subtle coronary occlusion may be completely missed by the computer and called "normal."  


This one was not even so subtle!!!

References:

1. Katie E. Hughes KE., Scott M. Lewis SM., Laurence Katz and Jonathan Jones  Safety of Computer Interpretation of Normal Triage Electrocardiograms (pages 120–124).  Academic Emergency Medicine 24(1):120-124. January 2017. 
 http://onlinelibrary.wiley.com/doi/10.1111/acem.13067/full


Results: A total of 855 triage ECGs were collected over 16 weeks. A total of 222 (26%) were interpreted by the computer as normal. The negative predictive value for a triage ECGs interpreted by the computer as “normal” was calculated to be 99% (95% confidence interval = 97% to 99%). Of the ECGs with a computer interpretation of normal ECG, 13 had an interpretation by an attending cardiologist other than normal. Two attending EPs reviewed these triage ECGs. One of the 13 ECGs was found to have clinical significance that would alter triage care by one of the EPs. The stated triage intervention was “bed immediately.”


2. Mawri S, Michaels A, Gibbs J, et al. The Comparison of Physician to Computer Interpreted Electrocardiograms on ST-elevation Myocardial Infarction Door-to-balloon Times. Critical Pathways in Cardiology 2016;15:22-5.

3. Garvey JL, Zegre-Hemsey J, Gregg RE, Studnek JR. Electrocardiographic diagnosis of ST segment elevation myocardial infarction: An evaluation of three automated interpretation algorithms Journal of Electrocardiology 2016;49:728-32.


Saturday, June 10, 2017

A patient with shortness of breath

This 50-something with a history of alcohol abuse complained of 2 weeks of increasing dyspnea for 2 weeks, with some chest pain and cough.  She was not ill-appearing.

Her BP was 111/68, with a heart rate of 117, RR 22, Temp 36.4 C and SpO2 of 95%.

She had a routine ECG performed at triage, as we do with all patients who are SOB.
What do you think?


I was brought this ECG and asked what I thought.

I responded: there is very low voltage and tachycardia, does the ultrasound show an effusion?

Here is the ED point of care ultrasound:

There is a huge effusion with collapse of the RV.  This is diagnostic of tamponade.


A pigtail catheter was placed and over 600 mL of serosanguinous fluid was drained.

Without going into details, she not surprisingly turned out to be much sicker than she initially appeared.

Low Voltage:

Defined as:

1.  less than 5 mm of QRS amplitude in limb leads
2.  less than 10 mm of QRS amplitude in precordial leads

Etiologies:

Fluid: pericardial effusion and pleural effusion
Fat: Obesity
Air: Emphysema or pneumothorax
Infiltrative disease: Amyloidosis, Myxedema, Sarcoid, Hemochromatosis
Loss of Viable Myocardium: Old MI, especially in multiple locations; Nonspecific dilated cardiomyopathy


Sunday, June 4, 2017

Huge ST Elevation in V2 and V3. What is it?

A 30-something presented with methamphetamine use and agitation.  He was sedated, then had an ECG as part of his workup:


He was stabilized and observed.


He was still confused 8 hours later when I was now on duty, and he was found to have a heart rate of 140, so another ECG was recorded:
There is one lead (V2) with massive ST elevation.
Since there is very little STE in V1 or V3, there must be lead misplacement.


I suspected some lead misplacement and ordered another with the leads corrected:
Now there is massive STE in BOTH leads V2 and V3
What do you think?
What do you want to do?


What do you think?  This is what I thought:

First, whenever I see ST elevation in the setting of severe tachycardia, I am very skeptical of STEMI. STEMI is only associated with tachycardia when there is 1) cardiogenic shock or 2) another simultaneous pathology.

Second, the ST Elevation just does not look like the STE of anterior STEMI.  How do I explain?  I'm not sure.  All I can do is show you as many ECGs as possible until you see the difference.  For me, it is like recognizing a face (or not).  This is not the face of anterior STEMI.

Third.  Of course you must always be vigilant and realize that you can mis-recognize a face, especially if you don't have my experience.  ("Sorry I didn't recognize you!  I thought you were my friend PseudoSTEMI.....")

With this blog, I'm trying to help you get that extra experience, and to recognize these patterns.


What do you want to do?  Go see the patient, of course.

The patient was agitated and confused and able to say that he did not have chest pain, but did have a sore throat (important: he can feel pain).  His throat was very erythematous (the throat pain was NOT due to MI, as is sometimes the case).

He was clearly NOT in cardiogenic shock.  He felt hot and so I measured an oral temp (102.2 F = 38.5 C) and then a rectal temp (104.9 F = 40.5 C).  We did a point of care ultrasound which showed hyperdynamic function and all walls clearly contracting normally.

We treated him for hyperthermia (acetaminophen and cool mist) and infection, gave fluids, antibiotics, and high dose benzodiazpines (lorazepam).  He needed to be intubated for altered mental status and agitation.  He had a negative head CT and lumbar puncture.

His heart rate slowly came down to 129.

Another ECG was recorded:
Almost all ST Elevation is resolved


He was admitted to the ICU.

He was found to have clonus later that night, all but diagnostic of serotonin syndrome (for which he had already been appropriately treated).  A comprehensive drug screen (ours routinely uses extremely sensitive mass spectrometry on all cases) confirmed amphetamine and methamphetamine, both of which can cause serotonin syndrome.

All troponins overnight were below the level of detection.

An ECG was recorded the next morning:
This is suggestive of Type 2 Brugada syndrome (see criteria below).


Whether there is or is not type 2 Brugada is uncertain.  Strictly speaking, this appears to meet the criteria.  But as the posts below demonstrate, type 2 Brugada is pretty vague and its significance uncertain and probably exaggerated.

Why does tachycardia lead to such ST Elevation, and how did you know it was not a STEMI?

I don't know why this happens.  I've just seen a lot of it and recognized it as NOT a STEMI.

Perhaps a type 2 Brugada at baseline, in combination with serotonin syndrome, resulted in ST elevation?


Learning Point:

See above.  When there is severe tachycardia, STE is unlikely to be STEMI unless there is cardiogenic shock.  Assess the whole patient, do a full evaluation, get the heart rate down, then re-evaluate the ECG findings.  Do a high quality cardiac ultrasound.


Criteria for Type 2 Brugada syndrome

See these posts:

Is this Type 2 Brugada syndrome/ECG pattern?


For an important update on this post, go here:

Non-Vagal Syncope and Saddleback Morphology in V2

This is a post showing the difficulty of the decision to place an implanted defibrillator.

First, there must be:
a) An RSr' with a typical saddleback pattern in V1 and/or V2. 
b) V1 may have either an upright, flat, or inverted T-wave (in our case above it is inverted).
c) T-wave in V2 is usually but not always positive.
d) Minimum ST segment ascent of 0.5 mm.  There could be no saddle without an ascent.

Once these are fulfilled, there should be, in lead V2:
1.  High take-off of the descending limb of the r' at least 2 mm above the isoelectric line. The r'-wave is thus not distinct, as it is in benign causes of rSr'
2.  Mismatch between QRS duration in leads V1 and V6 (longer in lead V1).  This helps to distinguish from RBBB, in which the QRS duration is equal in V1 and V6.
3. As with Type 1, the peak of the r'-wave does not correspond to the J-point in other leads.
4. The base of the triangle outlined should be longer than 3.5 mm.  This confirms that the slope of the ST segment is flat enough for the diagnosis.  I explain this in an annotated version here:
Explanation
1. Draw a horizontal line from top of r' wave (black line 1)
2. Draw a horizontal line 5 mm below this (green line 2)
3. Extend the downsloping r'-ST segment (black line 3) until it intersects the green line
4. Measure the base.  

If greater than 3.5 mm, then meets criteria (this is equivalent to a 35 degree beta angle)


Thursday, June 1, 2017

ST Elevation in I and aVL, with reciprocal ST depression in lead III

This ECG was texted to me with no clinical information:
What do you think?


Here is my response:


"This EKG looks a bit worrisome.  The only reason I hesitate to say that the STE in aVL with reciprocal STD in III is NOT due to MI is that there are very well formed J-waves in aVL.   But not in I.  aVL does not usually have normal variant ST elevation.  aVF is very abnormal too, with a down up T-wave.  If you have suspicion of MI, I would be very worried.  Not diagnostic, but needs an echo."

After going to the chart and reading the history, this is what I texted back:


"I just read the HPI. With a chief complaint of weakness, I would not be very concerned.  Pretest probability is low."

Here is the history.

An approximately 50 year old woman with no cardiac history, but on multiple medications for diabetes, hypertension, and psychiatric disorders complained of weakness.  Since weakness is certainly potentially a symptom of ACS, an ECG was immediately ordered.


Here is the first ECG again:
What do you think?

Here is an old ECG for comparison:


So the ST Elevation is new, but the STE of normal variant (often called "early repolarization") can change.  Is this a strange kind of normal variant in aVL?  Or is there a subtle STEMI?  Or something else?

And that wave in aVF is distinctly abnormal.

What is going on??

Any time you don't know what is going on, it might be hyperkalemia, especially if the chief complaint is weakness.

The K was 7.0 mEq/L

And the Na was 99 mEq/L !!!!!

Now look at aVF again, and you'll see in retrospect that the T-wave is peaked.  In fact, all of the T-waves are subtly peaked.

Sodium?
(There are case reports, but I have not been able to find any actual literature to support any specific findings on the ECG for hyponatremia, or even hypernatremia.  This is contrary to intuition.  I would think that hyponatremia might show similar findings to sodium channel blockers (just as hypokalemia and K channel blockers often show U-waves).

If you know of any literature, please let me know.

The hyperK was treated.

Here is the post-treatment ECG:
The STE is gone and the T-waves are far less peaked.


The patient was admitted and treated.  Her K went down to normal.

Some time later, her K rose again to 6.4 mEq/L (and Na of 108) and another ECG was recorded:
There is some recurrent STE in I and aVL, with, again, reciprocal STD in III.
And even a biphasic (down-up) T-wave, which usually indicates ischemia.


The etiology of the electrolyte abnormalities was uncertain. The patient was quite dehydrated.  Renal function was ok.  There was probably some polydispsia.  Adrenal function was normal.  Kidneys were excreting appropriately dilute urine.


Learning Points:

1. Hyperkalemia is the syphilis of ECG findings: it can present as anything.
2. Hyperkalemia is a common source of pseudoSTEMI.

See these cases:

Hyperkalemia and ST Segment Elevation, Post 1


Recommended Resources